Índice8 secciones
When a private equity firm sold a mid-market software company in Q2 2021 at 15.2x EBITDA, it represented the culmination of a decade-long bull market, near-zero interest rates, and unprecedented liquidity. Fast forward to 2025-2026, and that same transaction multiple would be not just irrelevant—it would be dangerously misleading for valuation professionals attempting to benchmark current deals.
The challenge facing corporate development teams, M&A advisors, and valuation specialists today is not simply identifying comparable transactions. It's understanding how to adjust historical transaction multiples for the seismic shifts in market conditions that have occurred over the past four years. This technical discipline separates sophisticated valuation work from superficial comparables analysis.
01 The 2021 Peak: Understanding What Made It Exceptional
To properly adjust transaction multiples, we must first understand what made 2021 such an outlier year. The confluence of factors that drove valuations to historic highs included:
- Federal funds rate at 0.00-0.25%: The cost of capital was at generational lows, making leverage extraordinarily cheap and driving up what acquirers could afford to pay
- SPAC boom: Over 600 SPACs raised $162 billion in 2021, creating artificial demand and inflating exit expectations across private markets
- Negative real yields: With inflation rising but rates still suppressed, investors faced negative real returns on safe assets, pushing capital into riskier acquisitions
- Dry powder peak: Private equity firms held over $1.8 trillion in undeployed capital, creating intense competition for quality assets
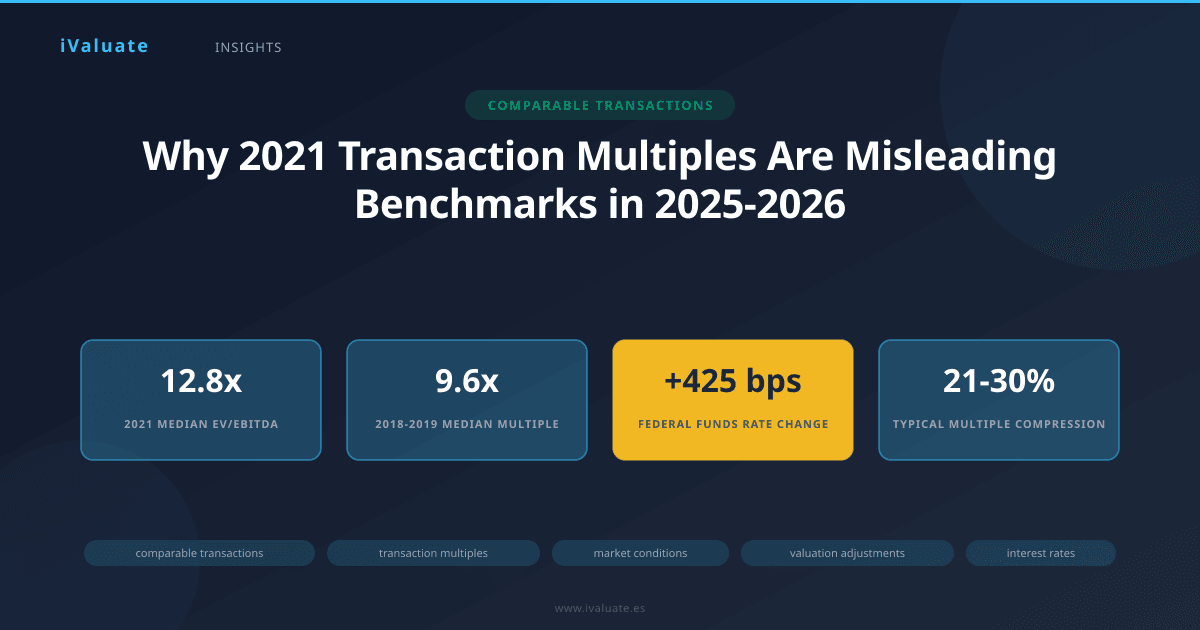
The median EV/EBITDA multiple for middle-market transactions in 2021 reached 12.8x according to PitchBook data—a full 3.2 turns higher than the 2015-2019 average of 9.6x. In high-growth sectors like software and healthcare IT, multiples routinely exceeded 15x, with premium assets commanding 20x or higher.
A transaction multiple is not a universal constant—it's a snapshot of a specific moment in time, reflecting the risk-free rate, growth expectations, sector sentiment, and capital availability that existed on that particular day.
02 The Rate Environment: The Single Most Important Adjustment Factor
The most quantifiable and impactful change between 2021 and 2025-2026 is the interest rate environment. The Federal Reserve's aggressive tightening cycle, which began in March 2022, fundamentally altered the mathematics of valuation.
The Discount Rate Effect
When the federal funds rate stood at 0.00-0.25% in 2021, the weighted average cost of capital (WACC) for a typical middle-market company might have been 7-8%. By mid-2023, with rates at 5.25-5.50%, that same company's WACC had increased to 11-13%. Even with the modest rate cuts in late 2024 and early 2025, bringing the federal funds rate to approximately 4.25-4.50%, the cost of capital remains structurally higher.
This has a mathematical impact on valuation multiples. Using a simple perpetuity growth model, if we assume a company generates $10 million in EBITDA with 3% perpetual growth:
- 2021 scenario (8% WACC): Enterprise Value = $10M / (0.08 - 0.03) = $200M = 20.0x EBITDA
- 2025 scenario (12% WACC): Enterprise Value = $10M / (0.12 - 0.03) = $111M = 11.1x EBITDA
This simplified example illustrates a 44% decline in valuation multiple purely from the change in discount rate, holding all other factors constant. In practice, the adjustment is more nuanced, but the directional impact is undeniable.
The Leverage Effect
Beyond the discount rate, the cost and availability of debt financing has changed dramatically. In 2021, sponsors could secure debt at 5.5-6.0x EBITDA with interest rates of L+400-450 basis points. By 2025-2026, leverage has contracted to 4.0-4.5x EBITDA, and spreads have widened to SOFR+500-600 basis points, with the base rate itself 400+ basis points higher.
For a $100 million EBITDA company, this means:
- 2021: $550-600M in debt at ~5% all-in cost
- 2025: $400-450M in debt at ~10% all-in cost
The equity check required to complete the same transaction has increased substantially, while the returns on that equity are compressed by higher debt service costs. This forces buyers to pay lower multiples to achieve their target IRRs.
03 Deal Vintage and Market Timing: Beyond Interest Rates
While interest rates provide the most quantifiable adjustment mechanism, other market timing factors require qualitative assessment and professional judgment.
Economic Growth Expectations
The 2021 market priced in aggressive growth assumptions coming out of the pandemic. GDP growth forecasts for 2022-2024 were optimistic, and companies were valued on the expectation of rapid revenue expansion. By 2025-2026, growth expectations have moderated significantly. The IMF's current global growth forecast of 3.1% for 2025-2026 compares to the 6.0% rebound growth seen in 2021.
When adjusting a 2021 comparable, analysts must consider whether the revenue growth assumptions embedded in that multiple are still realistic. A software company that was valued at 15x EBITDA assuming 30% annual growth may only warrant 10x if current market conditions support 15% growth.
Sector-Specific Cycles
Different industries experienced different timing of their valuation peaks. Technology peaked in late 2021, healthcare in early 2022, and industrial sectors showed more resilience into 2023. When selecting and adjusting comparables, understanding the sector-specific vintage is critical.
For example, a cybersecurity transaction from Q4 2021 at 18x EBITDA reflected not just general market exuberance but also sector-specific factors: the SolarWinds breach aftermath, accelerating cloud migration, and zero-trust architecture adoption. By 2025, while cybersecurity remains important, the urgency premium has normalized, and multiples in the sector have compressed to 11-13x for similar assets.
Competitive Dynamics and Strategic Premium
The 2021 market saw intense competition for quality assets, with multiple bidders driving up prices and strategic buyers paying significant premiums to prevent assets from going to competitors. The median number of bidders in competitive middle-market processes exceeded 8-10 in 2021, compared to 4-6 in 2025-2026.
When a 2021 transaction involved a competitive auction with strategic buyers, the multiple may include a 20-30% premium above financial buyer valuations. This premium must be stripped out when using the transaction as a comparable for a current financial buyer process.
04 Normalization Techniques: A Practical Framework
Professional valuation requires systematic approaches to adjusting historical multiples. Here are the techniques employed by leading advisory firms:
1. The Rate-Adjusted Multiple Method
This quantitative approach adjusts historical multiples based on changes in the risk-free rate and credit spreads:
Adjusted Multiple = Historical Multiple × (1 - β × ΔWACC)
Where β represents the sensitivity of the multiple to changes in WACC (typically 0.3-0.5 for EBITDA multiples) and ΔWACC is the change in weighted average cost of capital.
For a 2021 transaction at 15.0x EBITDA, with WACC increasing from 8% to 12% (ΔWACC = 4.0%) and β = 0.4:
Adjusted Multiple = 15.0x × (1 - 0.4 × 0.04) = 15.0x × 0.984 = 14.8x
This suggests a relatively modest adjustment, but remember this captures only the mathematical discount rate effect, not the full market regime change.
2. The Comparable Period Method
This approach identifies transactions from a period with similar market conditions to today, rather than adjusting recent deals. For 2025-2026 valuations, looking at 2018-2019 comparables may be more relevant than 2021-2022, as both periods featured:
- Federal funds rates in the 4-5% range
- Normalized credit markets without QE distortions
- Moderate economic growth expectations
- Rational competition for assets without SPAC-driven excess
The median middle-market multiple in 2018-2019 was 9.6x EBITDA—substantially below the 12.8x seen in 2021 but potentially more relevant for current valuations.
3. The Regression-Based Approach
Sophisticated practitioners build regression models that relate transaction multiples to observable market variables:
EV/EBITDA = α + β₁(10Y Treasury) + β₂(Credit Spread) + β₃(VIX) + β₄(GDP Growth) + ε
By estimating these relationships using historical transaction data, analysts can predict what a 2021 transaction would have traded at under current market conditions. This approach requires substantial data and statistical expertise but provides the most defensible adjustments.
4. The Scenario Analysis Framework
Rather than selecting a single adjusted multiple, best practice involves presenting a range based on different market condition scenarios:
- Optimistic scenario: Assumes rate cuts continue, growth accelerates, and multiples expand toward 2021 levels (12-13x)
- Base case scenario: Assumes current conditions persist with modest growth (9-10x)
- Conservative scenario: Assumes economic slowdown, further multiple compression (7-8x)
This approach acknowledges the uncertainty inherent in market timing adjustments and provides decision-makers with a range of outcomes.
05 Real-World Application: Three Case Studies
Case Study 1: Enterprise Software Company
A middle-market enterprise software company with $25 million in EBITDA sought valuation guidance in Q1 2025. The most comparable transaction was a similar business sold in Q3 2021 at 16.5x EBITDA.
Key adjustments made:
- Rate adjustment: WACC increased from 7.5% to 11.5%, suggesting a 15-20% multiple compression
- Growth normalization: 2021 comp assumed 35% growth; current company projecting 20% growth, warranting additional 10-15% reduction
- Market liquidity: Reduced competition and longer sale processes in 2025 suggested 5-10% discount
Adjusted multiple range: 11.5x - 13.0x EBITDA, representing a 21-30% reduction from the 2021 comparable. The company ultimately transacted at 12.2x, validating the adjustment framework.
Case Study 2: Healthcare Services Business
A specialty healthcare services provider with $15 million in EBITDA used a 2021 transaction at 14.8x as a benchmark. However, several factors required adjustment:
- The 2021 comp included a strategic premium (estimated 25%) that wouldn't apply to a financial buyer process
- Reimbursement rate uncertainty had increased by 2025, adding risk premium
- Interest rate impact on leveraged returns
After adjustments, the normalized multiple range was 9.5x - 10.5x, nearly 35% below the headline 2021 number. This case illustrates how strategic premiums and sector-specific risk changes can compound the rate-driven adjustments.
Case Study 3: Industrial Distribution Company
An industrial distribution business with stable, recession-resistant cash flows showed less dramatic adjustment needs. A 2021 comp at 11.2x was adjusted to 9.8x - 10.5x, only a 12% reduction at the midpoint.
The more modest adjustment reflected:
- Lower baseline multiple in 2021 (sector didn't experience the same exuberance)
- Defensive characteristics that perform better in higher-rate environments
- Consistent cash generation that supports higher leverage even at elevated rates
This demonstrates that adjustment magnitude varies significantly by sector and business model.
06 Common Pitfalls in Multiple Adjustment
Even experienced professionals make errors when adjusting transaction multiples. The most frequent mistakes include:
Over-Reliance on Mechanical Formulas
While quantitative adjustments provide a starting point, blindly applying formulas without considering qualitative factors leads to errors. A 2021 transaction that included unusual terms, earn-outs, or strategic rationale cannot be mechanically adjusted—it requires deeper analysis.
Ignoring Transaction Structure
A 2021 deal done at 15x EBITDA with 40% of consideration in earn-outs is not comparable to a 2025 deal with 90% cash at close. The headline multiple must be adjusted for structural differences before applying market condition adjustments.
Failing to Adjust for Company-Specific Changes
If the comparable company had 25% EBITDA margins in 2021 and your subject company has 18% margins, you cannot simply apply the same multiple. Company-specific quality differences must be addressed separately from market timing adjustments.
Anchoring Bias
Clients often anchor to the highest multiples they've seen, typically from 2021. Professional valuators must educate stakeholders on why those multiples are no longer achievable, using data and clear explanations of market changes.
07 The Forward-Looking Perspective: 2025-2026 and Beyond
As we navigate 2025-2026, several trends will continue to influence how we think about transaction multiples and market timing:
Rate Trajectory Uncertainty
The Federal Reserve's path remains data-dependent. If inflation proves stickier than expected, rates may stay elevated longer, keeping multiples compressed. Conversely, if economic growth slows materially, rate cuts could provide some multiple expansion, though likely not back to 2021 levels.
Sector Divergence
The gap between high-growth technology multiples and traditional industry multiples, which compressed during the 2022-2023 correction, is beginning to widen again. AI-related businesses are commanding premiums reminiscent of 2021, while traditional sectors remain at normalized levels. This sector-specific divergence requires careful consideration in comparables selection.
Private Equity Dry Powder Deployment
With over $2.5 trillion in dry powder as of early 2025, private equity firms face pressure to deploy capital. This could support multiples even in a higher-rate environment, though likely with more disciplined underwriting than in 2021.
The Importance of Sophisticated Tools
Given the complexity of adjusting transaction multiples across different market regimes, valuation professionals increasingly rely on technology platforms that can systematically analyze comparable transactions, adjust for market conditions, and provide defensible ranges. Tools like iValuate enable practitioners to efficiently perform these complex adjustments, incorporating real-time market data and sophisticated normalization algorithms that would be prohibitively time-consuming to execute manually.
08 Conclusion: Discipline in Uncertain Times
The 15x EBITDA multiple from 2021 represents a specific moment in financial history—a confluence of zero rates, excess liquidity, and growth optimism that has not persisted. Using such multiples without rigorous adjustment is not just technically incorrect; it's a disservice to clients making critical capital allocation decisions.
Professional valuation in 2025-2026 requires understanding the interplay between interest rates, market liquidity, sector dynamics, and economic growth expectations. It demands both quantitative rigor in adjusting for observable factors like rate changes and qualitative judgment in assessing competitive dynamics, strategic premiums, and sector-specific cycles.
The practitioners who excel in this environment are those who can clearly articulate why historical multiples must be adjusted, provide transparent methodologies for those adjustments, and present ranges that acknowledge inherent uncertainty. They understand that a comparable transaction is never truly comparable until it has been normalized for the market conditions that prevailed at the time.
As market conditions continue to evolve, the ability to perform these adjustments efficiently and defensibly becomes a competitive advantage. Whether you're advising a client on a potential sale, evaluating an acquisition opportunity, or providing fairness opinions, the discipline of proper multiple adjustment separates sophisticated analysis from superficial benchmarking. Platforms like iValuate support this discipline by providing the data infrastructure and analytical capabilities that modern valuation professionals require to deliver authoritative, market-informed advice in an environment where yesterday's multiples are not tomorrow's reality.