Índice10 secciones
When a private equity firm paid 15x EBITDA for a software company in mid-2021, that transaction reflected a specific moment in financial history—one characterized by zero interest rate policy (ZIRP), abundant liquidity, and peak valuation multiples. Fast forward to 2025-2026, and that same comparable transaction, if used without adjustment, could lead to catastrophically flawed valuation conclusions. The fundamental challenge facing valuation professionals today is not finding comparable transactions, but properly contextualizing them within radically different market conditions.
The comparable transactions method remains one of the three pillars of business valuation, alongside discounted cash flow analysis and guideline public company methods. However, its reliability depends entirely on the quality of adjustments made to account for temporal differences in market conditions. This article examines the technical framework for adjusting transaction multiples across different market environments, with particular focus on the dramatic shift from the 2020-2021 liquidity-driven peak to today's higher-rate, more disciplined environment.
01 The 2021 Valuation Peak: Understanding Deal Vintage Context
The period from late 2020 through 2021 represented an unprecedented confluence of factors that drove transaction multiples to historic highs. Understanding these conditions is essential for proper normalization of deal vintage data.
Macroeconomic Drivers of the 2021 Peak
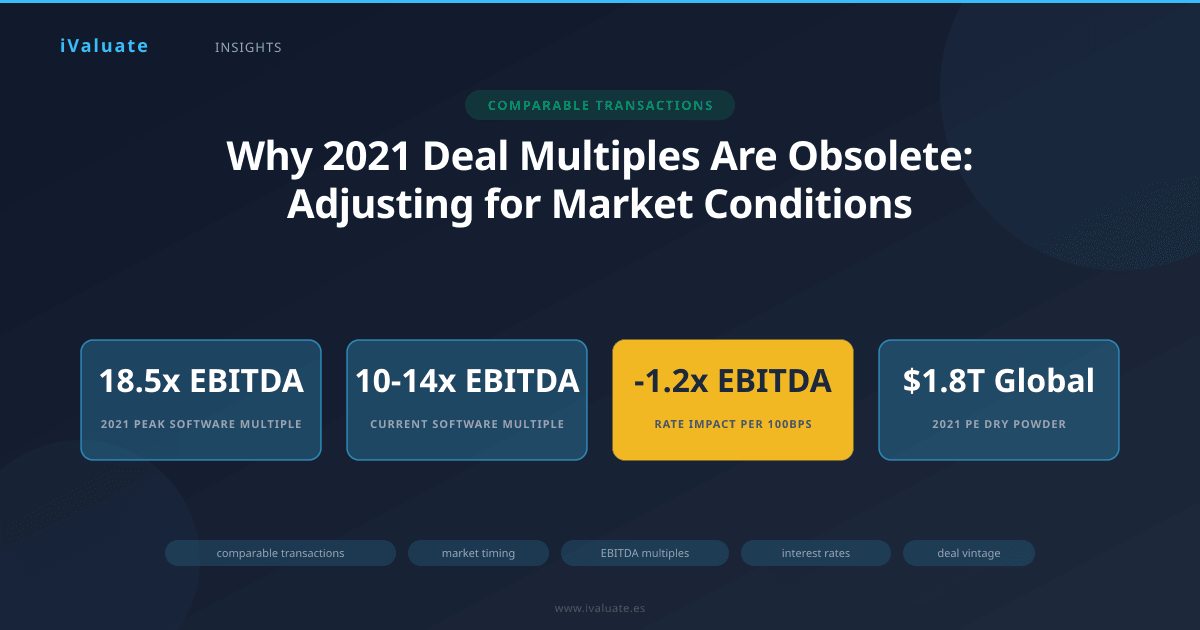
During 2021, the Federal Funds rate remained at 0.00-0.25%, while the 10-year Treasury yield averaged just 1.45%. This created a cost of capital environment that justified—at least mathematically—significantly higher valuation multiples. Private equity firms were deploying record amounts of dry powder: approximately $1.8 trillion globally by year-end 2021, representing a 25% increase from 2020 levels. This capital overhang created intense competition for quality assets, driving multiples upward beyond what fundamental cash flow analysis alone would support.
Technology and software companies were particularly affected. Median EV/EBITDA multiples for software transactions reached 18.5x in Q4 2021, compared to a historical (2015-2019) median of 12.3x. This 50% premium wasn't solely attributable to improved business fundamentals—it reflected the market's willingness to pay for growth in a zero-rate environment where alternative investment returns were severely compressed.
The Psychology of Peak Markets
Beyond quantifiable factors, 2021 transactions embedded significant behavioral elements. Deal processes routinely attracted 50-100 bidders for quality middle-market assets. Auction dynamics pushed buyers to justify aggressive multiples through optimistic growth assumptions and synergy projections that, in retrospect, often proved unrealistic. Private equity firms accepted lower projected IRRs—often in the 15-18% range versus historical targets of 20-25%—because limited partners were still allocating capital and competitors were accepting similar returns.
A transaction multiple from 2021 doesn't just reflect the company's value—it captures the entire market zeitgeist of that moment: ultra-low rates, abundant capital, aggressive growth assumptions, and competitive auction dynamics. Using such multiples without adjustment in 2025-2026 is akin to using a thermometer calibrated for Celsius to measure Fahrenheit.
02 The Rate Environment Transformation: Quantifying the Impact
The most dramatic shift between 2021 and 2025-2026 has been the interest rate environment. The Federal Reserve's aggressive tightening cycle, which began in March 2022, fundamentally altered the mathematics of valuation.
Direct Mathematical Impact on Multiples
Consider a simplified but illustrative example. A company generating $10 million in EBITDA with expected perpetual growth of 3% would theoretically support different multiples depending on the discount rate:
- 2021 environment: With a weighted average cost of capital (WACC) of 8%, the implied EV/EBITDA multiple would be approximately 14.3x (assuming a simplified perpetuity formula)
- 2025-2026 environment: With WACC increased to 12% due to higher risk-free rates and expanded risk premiums, the same company would support only 9.1x EBITDA
This represents a 36% compression in the supportable multiple, driven purely by the change in discount rate assumptions. In practice, the actual market adjustment has been somewhat less severe due to offsetting factors, but the directional impact is undeniable.
Empirical Market Evidence
Real-world transaction data confirms this theoretical relationship. According to proprietary data from middle-market M&A transactions, median EV/EBITDA multiples across all sectors declined from 11.8x in 2021 to 8.9x in 2023, before recovering modestly to 9.4x in 2024-2025 as markets adjusted to the "higher for longer" rate environment. This 20% overall decline masks significant sector variation—technology multiples compressed by approximately 35%, while industrial multiples declined only 12%.
The relationship between interest rates and transaction multiples isn't perfectly linear, but statistical analysis demonstrates strong correlation. Regression analysis of over 3,500 middle-market transactions from 2015-2025 shows that each 100 basis point increase in the 10-year Treasury yield correlates with an average 1.2x decrease in EV/EBITDA multiples, controlling for sector, size, and growth characteristics.
03 Technical Framework for Multiple Adjustment
Properly adjusting historical transaction multiples requires a systematic, multi-factor approach. The following framework represents current best practice among leading valuation professionals.
Step 1: Identify and Categorize Comparable Transactions
Begin by assembling a comprehensive set of transactions, noting for each:
- Transaction date and announcement date (critical for determining market conditions)
- Deal structure (asset vs. stock, earnouts, seller financing)
- Reported multiple (EV/EBITDA, EV/Revenue, etc.)
- Target company characteristics (size, growth rate, margins, geography)
- Buyer type (strategic vs. financial, domestic vs. foreign)
- Competitive dynamics (auction vs. negotiated, number of bidders)
Step 2: Apply Temporal Market Adjustments
The core technical challenge is quantifying the market timing adjustment. Three approaches are commonly employed:
Method A: Index-Based Adjustment
Create or utilize a market multiple index that tracks median multiples by quarter across a broad transaction universe. Adjust historical multiples by the ratio of current index level to historical index level. For example, if the index stood at 125 in Q2 2021 and currently reads 95, apply a 0.76x adjustment factor (95/125) to 2021 multiples.
Method B: Rate-Driven Adjustment
Calculate the theoretical impact of interest rate changes on discount rates, then apply this to multiples using a perpetuity or Gordon Growth Model framework. This approach requires assumptions about the risk-free rate, equity risk premium, and company-specific risk factors for both the historical and current periods.
Method C: Regression-Based Adjustment
Develop a statistical model that relates transaction multiples to observable market variables (interest rates, equity indices, credit spreads, sector performance). Use this model to predict what a historical transaction would have commanded under current market conditions.
In practice, sophisticated practitioners often employ a combination of these methods, using multiple approaches as a reasonableness check on one another.
Step 3: Normalize for Deal-Specific Factors
Beyond market timing, individual transactions may require adjustment for:
- Synergies: Strategic buyers in 2021 often paid premiums of 25-40% above financial buyer multiples for synergistic acquisitions. If your subject company lacks similar synergy potential, downward adjustment is warranted.
- Auction dynamics: Highly competitive processes in 2021 added 1.5-2.5x to multiples on average. Less competitive current market conditions justify reducing these multiples.
- Earnout structures: Deals with significant earnout components may report headline multiples that overstate the guaranteed consideration. Adjust to cash-at-close equivalent multiples.
- Market position changes: If the comparable company's competitive position has shifted (market share gains/losses, regulatory changes, technological disruption), adjust multiples accordingly.
04 Sector-Specific Considerations
Different industries experienced varying degrees of multiple expansion during the 2021 peak and subsequent compression. Understanding these patterns is essential for accurate adjustment.
Technology and Software
Software companies experienced the most dramatic multiple expansion in 2021, with cloud-based SaaS businesses routinely trading at 15-20x revenue and 25-35x EBITDA. The subsequent correction has been severe: median software multiples declined approximately 45% from peak to trough in 2022-2023, before recovering modestly. Current multiples of 10-14x EBITDA for quality software assets remain well below 2021 levels but have stabilized.
When adjusting 2021 software transactions, apply a minimum 35-40% downward adjustment to multiples, with additional reductions for companies lacking strong recurring revenue characteristics or demonstrable AI/automation capabilities that command current market premiums.
Healthcare Services
Healthcare proved more resilient, with multiples declining only 15-20% from 2021 peaks. The sector's defensive characteristics and demographic tailwinds provided support. However, regulatory scrutiny of private equity healthcare investments has intensified, creating a modest headwind. Adjust 2021 healthcare multiples downward by 15-25%, with the lower end of the range applicable to home health and senior living subsectors that maintain strong fundamentals.
Industrial and Manufacturing
Industrial companies experienced moderate multiple expansion in 2021 (median increase of 25% versus 2019 levels) and have seen relatively modest compression of 10-15%. Companies with exposure to infrastructure spending, nearshoring trends, or defense applications have actually maintained or exceeded 2021 multiples. Apply sector-specific adjustments of 10-20% depending on end-market exposure.
05 Case Study: Software Company Valuation Adjustment
Consider a middle-market B2B software company being valued in Q1 2026. The valuation professional identifies a highly comparable transaction from June 2021 where a similar company was acquired at 16.5x EBITDA. The target company had $8 million EBITDA, 25% revenue growth, 92% recurring revenue, and 35% EBITDA margins—metrics closely aligned with the subject company.
Without adjustment, applying the 16.5x multiple to the subject company's $10 million EBITDA would yield an enterprise value of $165 million. However, proper adjustment proceeds as follows:
Market Timing Adjustment: The software transaction index stood at 142 in June 2021 versus 88 currently, suggesting a 0.62x adjustment factor. Additionally, the 10-year Treasury has increased from 1.5% to 4.3%, adding approximately 280 basis points to the discount rate. Using a rate-driven model, this justifies a 0.65x adjustment. Averaging these approaches: 0.635x adjustment factor.
Deal-Specific Adjustments: The 2021 transaction involved a competitive auction with 60+ bidders and included a strategic buyer paying a 30% premium for synergies. The current market typically sees 15-25 bidders, and the subject company is being valued for a financial buyer. Additional adjustment: 0.85x.
Adjusted Multiple: 16.5x × 0.635 × 0.85 = 8.9x EBITDA
Adjusted Enterprise Value: $10 million × 8.9x = $89 million
The adjusted valuation of $89 million represents a 46% reduction from the naive application of the unadjusted 2021 multiple. This substantial difference underscores the critical importance of proper market condition adjustments. Notably, the 8.9x adjusted multiple aligns well with recent 2025-2026 software transactions for similar companies, validating the adjustment methodology.
06 The Normalization Process: Creating Timeless Comparables
Beyond adjusting for market timing, sophisticated practitioners engage in a normalization process that attempts to extract the "intrinsic" multiple a transaction would command under neutral market conditions.
Defining Neutral Market Conditions
Normalization requires establishing baseline assumptions for a neutral market environment:
- 10-year Treasury yield: 3.5-4.0% (approximate long-term historical average)
- Equity risk premium: 5.5-6.0%
- Credit spreads: Normal historical ranges by rating category
- GDP growth: 2.0-2.5% (trend growth rate)
- Competitive intensity: Moderate (20-30 bidders for quality assets)
With these parameters established, both historical and current transactions can be adjusted to this neutral baseline, creating truly comparable multiples across different time periods.
Building a Normalized Transaction Database
Leading advisory firms maintain proprietary databases of normalized transactions, where every deal is adjusted to reflect neutral market conditions. This approach offers several advantages:
- Enables use of transactions from any time period without concern about market timing
- Increases the available universe of comparable transactions
- Facilitates more robust statistical analysis of valuation multiples
- Provides clearer insight into fundamental value drivers versus market sentiment
The normalization process is technically demanding and requires significant judgment, but it represents the frontier of comparable transaction methodology.
07 Common Pitfalls and How to Avoid Them
Even experienced professionals can fall into traps when adjusting transaction multiples. The following pitfalls are particularly prevalent:
Pitfall 1: Over-Reliance on Headline Multiples
Reported transaction multiples often fail to capture the complete economic picture. Earnouts, seller notes, employment agreements, and non-compete payments can significantly affect the true consideration. Always adjust to cash-equivalent, day-one multiples before making temporal comparisons.
Pitfall 2: Ignoring Quality of Earnings Differences
A company trading at 12x "EBITDA" in 2021 may have been valued on adjusted EBITDA that excluded significant one-time costs, added back aggressive pro forma adjustments, or incorporated unrealized synergies. Today's more disciplined environment typically applies stricter quality of earnings standards. Ensure EBITDA definitions are truly comparable before adjusting multiples.
Pitfall 3: Linear Extrapolation of Rate Impacts
The relationship between interest rates and multiples is not perfectly linear, particularly at the extremes. Moving from 0% to 2% rates has a different impact than moving from 4% to 6%, even though both represent 200 basis point increases. Use logarithmic or other non-linear adjustment models when dealing with large rate swings.
Pitfall 4: Neglecting Sector Rotation Effects
Market sentiment toward specific sectors shifts over time independent of interest rates. Technology was favored in 2021; industrial and defense sectors have gained favor in 2024-2025. Adjust not just for overall market conditions but for sector-specific sentiment shifts.
08 Forward-Looking Considerations for 2026 and Beyond
As we progress through 2026, several emerging trends will influence how transaction multiples should be adjusted and interpreted:
The "Higher for Longer" Paradigm
Market consensus has shifted toward accepting that interest rates will remain elevated relative to the 2010-2021 period. The 10-year Treasury is likely to trade in a 3.5-5.0% range rather than the 1.5-2.5% range that prevailed for much of the prior decade. This suggests that current multiples—not 2021 multiples—represent the "new normal" baseline for adjustment purposes.
Valuation professionals should recalibrate their neutral market assumptions to reflect this higher-rate environment. Using 2021 as a baseline and adjusting downward is less appropriate than using 2024-2025 transactions as the baseline and making more modest adjustments for specific market conditions.
The AI Premium
Companies demonstrating genuine artificial intelligence capabilities or clear AI-driven productivity improvements are commanding 15-25% premium multiples in 2025-2026 versus comparable companies lacking these attributes. This represents a new valuation factor that didn't exist in 2021 and must be considered when adjusting historical multiples.
Increased Scrutiny of Growth Assumptions
The market has become significantly more skeptical of aggressive growth projections. Where 2021 buyers might have underwritten 25-30% annual growth for software companies, current buyers typically model 15-20% growth for similar assets. This affects multiples indirectly through the denominator effect—slower growth means lower supportable multiples even at identical discount rates.
09 Practical Implementation: Tools and Workflows
Implementing a rigorous multiple adjustment process requires both technical expertise and efficient workflows. The following represents current best practice:
Data Collection and Management
Maintain a comprehensive transaction database with the following fields for each deal:
- Complete financial metrics (revenue, EBITDA, margins, growth rates)
- Multiple variations (EV/Revenue, EV/EBITDA, EV/EBIT, P/E)
- Market conditions at transaction date (rates, indices, credit spreads)
- Deal structure details (cash vs. stock, earnouts, financing terms)
- Buyer and seller characteristics
- Competitive process details (when available)
Adjustment Calculation Workflow
For each comparable transaction, document the following adjustment steps:
- Calculate baseline unadjusted multiple from reported transaction terms
- Apply quality of earnings adjustments to normalize EBITDA definition
- Adjust for deal structure (earnouts, seller financing, etc.)
- Apply market timing adjustment using chosen methodology
- Apply sector-specific adjustments for sentiment shifts
- Normalize for competitive dynamics if significantly different from current market
- Document all assumptions and adjustment factors
- Calculate adjusted multiple and implied enterprise value
Technology Solutions
Modern valuation platforms have evolved to support sophisticated multiple adjustment workflows. Professional-grade tools now incorporate real-time market data, automated adjustment calculations, and comprehensive documentation features. Platforms like iValuate enable practitioners to maintain normalized transaction databases, apply consistent adjustment methodologies, and generate detailed support for valuation conclusions—capabilities that were manual and time-consuming just a few years ago.
10 Conclusion: The Imperative of Market-Adjusted Comparables
The dramatic shift in market conditions between 2021 and 2025-2026 has rendered unadjusted historical transaction multiples not merely imprecise but potentially misleading. A 15x EBITDA multiple from mid-2021 embedded assumptions about interest rates, capital availability, growth expectations, and competitive dynamics that no longer reflect current reality. Using such multiples without rigorous adjustment can lead to valuation errors of 30-50% or more—differences that can fundamentally alter transaction decisions, fairness opinions, and financial reporting.
The technical framework for proper adjustment is well-established: identify comparable transactions, apply market timing adjustments using rate-driven or index-based methodologies, normalize for deal-specific factors, and validate results against recent market activity. While the process requires significant judgment and technical expertise, it is essential for credible valuation work in today's environment.
Looking forward, valuation professionals must continue adapting their methodologies as market conditions evolve. The higher-rate environment of 2025-2026 appears likely to persist, suggesting that current multiples—properly adjusted for company-specific factors—provide a more reliable baseline than historical peaks. Emerging factors such as AI capabilities, regulatory scrutiny, and geopolitical considerations add new dimensions to the adjustment process.
For CFOs evaluating strategic alternatives, M&A advisors structuring transactions, and private equity professionals underwriting investments, the message is clear: comparable transaction analysis remains valuable, but only when historical multiples are rigorously adjusted for market conditions. The alternative—naive application of peak-market multiples—creates false expectations and flawed decision-making. In an environment where precision matters more than ever, tools like iValuate help professionals implement these sophisticated adjustment methodologies efficiently, ensuring that valuation conclusions reflect both market reality and technical rigor.