Índice11 secciones
When a venture capitalist offers to invest $5 million at a $15 million pre-money valuation, that number isn't arbitrary. Behind every term sheet lies a rigorous calculation that works backward from expected exit values and target returns. This approach—known as the Venture Capital Method—remains the dominant framework for pricing early-stage investments, even as market conditions in 2025-2026 have forced VCs to recalibrate their assumptions.
Unlike public market investors who can rely on comparable trading multiples or discounted cash flow models with reasonable confidence, venture investors face extreme uncertainty. Most startups have minimal revenue, negative earnings, and unproven business models. The VC Method addresses this reality by focusing on what matters most: the potential exit value and the ownership stake required to deliver target returns to limited partners.
01 The Fundamental Logic of the VC Method
The Venture Capital Method operates on a simple but powerful premise: determine what the company could be worth at exit, calculate what ownership percentage is needed to achieve target returns, and work backward to today's valuation. This approach aligns perfectly with how venture capital funds are structured and evaluated.
Consider the basic formula:
Required Ownership % = (Investment Amount × Target Return Multiple) ÷ Projected Exit Value
Once the required ownership is determined, the pre-money valuation follows:
Pre-Money Valuation = (Investment Amount ÷ Ownership %) - Investment Amount
Or more directly:
Post-Money Valuation = Investment Amount ÷ Ownership %
This mathematical framework forces discipline into what could otherwise be purely speculative pricing. Every valuation implicitly embeds assumptions about exit timing, exit multiples, and required returns—assumptions that sophisticated investors scrutinize intensely.
Target Return Multiples in Current Markets
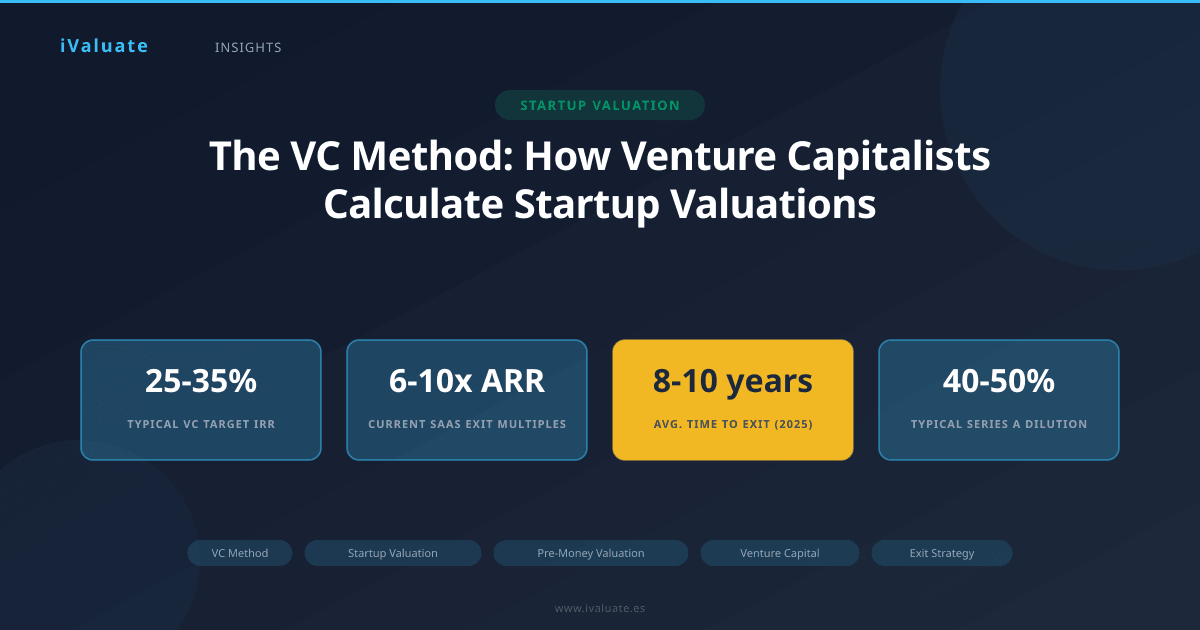
Venture capital target returns vary by stage, but the underlying economics are consistent. Early-stage funds typically target 25-35% IRR, which translates to specific return multiples depending on the holding period. For a five-year investment horizon—common for Series A investments—a 30% IRR requires approximately a 3.7x return multiple. Seed-stage investors often target 10x or higher given the extreme risk profile.
In 2025-2026, these targets have remained remarkably stable despite broader market volatility. While public tech valuations compressed significantly in 2022-2023, venture return expectations have proven stickier. Top-quartile funds still need to return 3-5x the fund to their limited partners after fees and carry, which means individual investments must target substantially higher multiples to account for inevitable losses.
The mathematics are unforgiving: if 60% of portfolio companies fail completely and another 20% return only 1-2x, the remaining 20% must generate 10x+ returns for the fund to succeed. This portfolio construction reality explains why VCs focus so intensely on exit potential rather than current metrics.
02 Exit Value Projections: The Critical Variable
The most consequential input in the VC Method is the projected exit value. Get this wrong, and the entire valuation framework collapses. Experienced investors build exit projections through multiple lenses simultaneously.
Revenue-Based Exit Multiples
For technology companies, exit valuations typically correlate most strongly with revenue at the time of exit. In 2025, SaaS companies achieving successful exits command median revenue multiples of 8-12x for acquisitions and 6-10x for IPOs, depending on growth rates and profitability profiles. These multiples have stabilized after the 15-20x peaks of 2020-2021 but remain well above the 3-5x multiples common in 2015-2018.
A VC evaluating a Series A investment in an enterprise SaaS company might project:
- Current ARR: $3 million
- Projected growth: 150% year 1, 120% year 2, 100% year 3, 80% year 4, 60% year 5
- Projected ARR at exit (year 5): $95 million
- Conservative exit multiple: 8x ARR
- Projected exit value: $760 million
This projection requires assumptions about market size, competitive dynamics, customer retention, and the company's ability to scale efficiently—all highly uncertain variables that separate successful VCs from unsuccessful ones.
Comparable Exit Analysis
Smart investors triangulate exit projections by studying recent comparable transactions. In the cybersecurity sector, for example, 2024-2025 saw notable exits including Wiz's $23 billion acquisition offer (declined), SentinelOne's market cap fluctuating between $6-8 billion, and numerous mid-market acquisitions in the $500 million to $2 billion range. These data points inform reasonable exit value ranges for similar companies at similar stages.
The challenge lies in identifying truly comparable companies. A horizontal SaaS platform serving SMBs faces entirely different exit dynamics than a vertical solution for enterprise healthcare. Market position, growth trajectory, and competitive moats matter enormously. VCs who excel at pattern recognition across hundreds of investments develop superior judgment about realistic exit scenarios.
03 Working Through a Complete VC Method Calculation
Let's examine a detailed Series A scenario that illustrates how all components interact:
Company Profile: B2B marketing automation platform, currently at $4 million ARR with 180% YoY growth, 95% net revenue retention, and a clear path to $100 million ARR within five years based on current market penetration and expansion plans.
Investment Terms: Series A round of $12 million
Step 1: Project Exit Value
- Projected ARR at year 5: $100 million
- Comparable exit multiples for marketing tech: 7-10x ARR
- Conservative assumption: 8x ARR
- Projected exit value: $800 million
Step 2: Determine Required Ownership
- Target return multiple: 10x (aggressive but appropriate for Series A)
- Required return: $12 million × 10 = $120 million
- Required ownership at exit: $120 million ÷ $800 million = 15%
Step 3: Account for Dilution
This is where many entrepreneurs misunderstand the calculation. The 15% ownership must be maintained through exit, but the company will likely raise additional rounds. If the VC expects two more financing rounds with 25% dilution in aggregate, they need to own 20% post-Series A to retain 15% at exit (20% × 0.75 = 15%).
Step 4: Calculate Pre-Money and Post-Money Valuation
- Post-money valuation: $12 million ÷ 20% = $60 million
- Pre-money valuation: $60 million - $12 million = $48 million
This $48 million pre-money valuation emerges directly from the exit assumptions and return requirements. If the entrepreneur argues for a $70 million pre-money valuation, the VC must either believe in a higher exit value, accept lower returns, or pass on the investment.
The Dilution Factor: Often Overlooked, Always Critical
Dilution assumptions separate sophisticated VC Method applications from naive ones. Early-stage companies almost invariably require multiple financing rounds before exit. Each round dilutes existing shareholders proportionally.
Consider a typical dilution scenario for a Series A company:
- Series B (18 months later): 20% dilution
- Series C (30 months after B): 15% dilution
- Employee option pool expansions: 10% cumulative dilution
- Total dilution from Series A to exit: approximately 40%
A VC who owns 20% post-Series A would own only 12% at exit after this dilution cascade. If their model requires 15% ownership at exit, they must negotiate for 25% at the Series A to maintain their target stake. This mathematics explains why early-stage investors often seem to demand high ownership percentages—they're planning for inevitable dilution.
In 2025-2026, dilution assumptions have become more conservative as the median time to exit has extended. Where companies once reached exit in 6-8 years, many now require 8-10 years, necessitating additional financing rounds and greater cumulative dilution. This reality has put downward pressure on pre-money valuations across all stages.
04 Real-World Applications and Market Examples
The VC Method's theoretical elegance meets practical complexity in actual negotiations. Three recent examples (details modified to preserve confidentiality) illustrate common scenarios:
Case 1: The High-Growth SaaS Company
A vertical SaaS platform serving the construction industry approached multiple VCs for a $15 million Series A. The company had reached $5 million ARR with 200% growth and exceptional unit economics. One leading firm offered a $65 million pre-money valuation based on these assumptions:
- Projected ARR at exit (year 6): $150 million
- Exit multiple: 10x (premium for vertical dominance)
- Exit value: $1.5 billion
- Target return: 8x
- Required proceeds: $120 million
- Required ownership at exit: 8%
- Expected dilution: 50%
- Required ownership post-Series A: 16%
- Implied post-money: $93.75 million
- Implied pre-money: $78.75 million
The firm ultimately offered $65 million pre-money, reflecting some negotiation flexibility but also concerns about execution risk. The entrepreneur accepted, understanding that the valuation reflected realistic exit scenarios rather than arbitrary pricing.
Case 2: The Marketplace with Network Effects
A B2B marketplace connecting manufacturers with suppliers raised $20 million at a $130 million pre-money valuation. The lead investor's model projected:
- Current GMV: $50 million annually
- Projected GMV at exit: $2 billion
- Exit value: $600 million (0.3x GMV, typical for marketplaces)
- Target return: 6x (later stage, lower risk)
- Required proceeds: $120 million
- Required ownership: 20%
- Post-money valuation: $100 million
The $130 million pre-money represented a premium over the pure VC Method calculation, justified by competitive dynamics—two other firms were bidding aggressively. This illustrates how market forces can push valuations above model-driven prices, though the underlying framework still anchors negotiations.
Case 3: The Deep Tech Pivot
An AI infrastructure company pivoted from a horizontal platform to a vertical solution for financial services. Despite strong technology, the pivot reset the valuation clock. The Series A investor offered $8 million at a $22 million pre-money, down from a $40 million valuation discussed pre-pivot. The calculation:
- Projected exit value: $400 million (reduced from $800 million for horizontal play)
- Target return: 12x (higher given pivot risk)
- Required proceeds: $96 million
- Required ownership: 24%
- Post-money: $33.3 million
- Pre-money: $25.3 million
The final $22 million pre-money reflected the investor's concerns about execution risk post-pivot. The entrepreneur initially resisted but ultimately accepted, recognizing that the alternative was raising at even lower valuations from less sophisticated investors or running out of capital.
05 Limitations and Criticisms of the VC Method
Despite its widespread use, the VC Method has significant limitations that practitioners must acknowledge. The approach is only as good as its assumptions, and those assumptions are often wildly uncertain for early-stage companies.
The Exit Value Problem
Projecting exit values five to seven years forward requires forecasting revenue growth, market conditions, and acquisition multiples—all notoriously difficult. A company projecting $100 million in revenue might achieve $150 million or $60 million; exit multiples might be 12x or 5x depending on market conditions. Small changes in assumptions produce massive valuation swings.
Consider the sensitivity: if exit value assumptions drop from $800 million to $600 million (a 25% reduction), and the investor maintains their target return, the pre-money valuation must drop from $48 million to $30 million (a 37.5% reduction). This leverage works both ways—optimistic assumptions can justify stratospheric valuations, while pessimistic ones suggest passing entirely.
The Terminal Value Fallacy
The VC Method focuses exclusively on exit value, ignoring the journey to get there. A company might achieve the projected revenue but burn through excessive capital, requiring dilutive financings that destroy the original investor's returns. The method doesn't explicitly model capital efficiency, competitive dynamics, or execution risk beyond the crude instrument of required return multiples.
Market Timing and Cyclicality
Exit multiples vary dramatically with market conditions. The same company exiting in 2021 might command 15x revenue, while an identical exit in 2023 might fetch 6x. The VC Method requires assumptions about exit timing and market conditions years in advance—assumptions that are often wrong. Sophisticated investors stress-test their models across multiple exit scenarios, but the fundamental uncertainty remains.
06 Advanced Considerations: Option Pool, Liquidation Preferences, and Participation
The basic VC Method calculation becomes more complex when accounting for option pools and liquidation preferences. These terms significantly affect the economics but are often glossed over in initial valuations.
Option Pool Dynamics
VCs typically require companies to establish or expand employee option pools before investment, and these pools are usually created from the pre-money valuation. A 15% option pool created pre-money dilutes existing shareholders but not the new investor. This means:
- Pre-money valuation: $48 million
- 15% option pool created: reduces founder ownership proportionally
- Investment: $12 million
- Post-money valuation: $60 million
- VC ownership: 20% (as intended)
- Founder ownership: reduced by both the investment and option pool
Founders often negotiate for option pools to be created post-money or at smaller sizes, as this affects their dilution significantly. A $48 million pre-money valuation with a 15% pre-money option pool is economically equivalent to approximately a $42 million pre-money valuation with no option pool for the founders.
Liquidation Preferences and Return Calculations
Most VC investments include liquidation preferences—typically 1x non-participating—that guarantee the investor receives their money back before common shareholders in an exit. In the VC Method, this protection matters primarily in downside scenarios. If the exit value is lower than projected, the liquidation preference ensures the VC still achieves some return while common shareholders might receive nothing.
Some term sheets include participating preferred structures, where investors receive their liquidation preference plus their pro-rata share of remaining proceeds. These terms effectively increase the investor's economic ownership above their nominal percentage, which should theoretically reduce the pre-money valuation they're willing to pay. In practice, participating preferred has become less common in 2025-2026 as founder-friendly terms have gained prevalence.
07 The VC Method in Different Market Environments
Market conditions dramatically influence every input in the VC Method. The 2020-2021 venture boom saw inflated exit assumptions and compressed return requirements, driving valuations to unprecedented levels. The 2022-2023 correction reversed these trends sharply.
In the current 2025-2026 environment, we observe:
- Exit multiples: Stabilized at 6-10x revenue for quality SaaS companies, down from 15-20x peaks but above historical 4-6x averages
- Time to exit: Extended to 8-10 years for most companies, up from 6-8 years in the 2010s
- Required returns: Remained stable at 25-35% IRR for early-stage, as LPs still demand top-quartile performance
- Dilution assumptions: Increased as companies require more rounds and longer runways
These shifts have created downward pressure on valuations across all stages. A Series A company that might have commanded a $100 million pre-money valuation in 2021 might receive $50-60 million in 2025 for identical metrics, purely due to changed exit assumptions and extended timelines.
08 Comparing the VC Method to Alternative Approaches
While the VC Method dominates early-stage pricing, investors often triangulate with other methodologies to validate their conclusions.
Scorecard and Berkus Methods
For pre-revenue companies, some investors use scorecard methods that assign values to qualitative factors (team quality, market size, technology, etc.). These approaches typically produce valuations in the $2-5 million range for seed-stage companies. The VC Method can validate these by working backward: if a seed investor targets 20x returns and projects a $400 million exit, they can justify a $1 million investment for 25% ownership (implying a $3 million pre-money valuation).
Discounted Cash Flow
Traditional DCF models struggle with early-stage companies due to negative cash flows and extreme uncertainty. However, some investors build DCF models for later-stage companies (Series B+) with meaningful revenue. These models typically produce valuations 20-40% below VC Method valuations, as DCF inherently applies higher discount rates and more conservative growth assumptions. The gap reflects the option value embedded in venture investments—the potential for outlier outcomes that DCF models don't fully capture.
Comparable Company Analysis
Public and private market comparables provide reality checks on valuations. If public SaaS companies trade at 8x revenue and a private Series B company seeks 15x revenue, investors demand extraordinary justification. In 2025, the gap between public and private valuations has narrowed significantly from the 2020-2021 period, when private companies routinely commanded premiums of 50-100% over public comparables.
09 Practical Implications for Entrepreneurs and Investors
Understanding the VC Method empowers both sides of the negotiating table. Entrepreneurs who grasp the underlying mathematics can have more productive valuation discussions, focusing on the assumptions that matter rather than arguing over arbitrary numbers.
For Entrepreneurs
When a VC proposes a valuation, ask about their assumptions:
- What exit value are they modeling?
- What exit timeline?
- What return multiple do they require?
- How much dilution are they assuming?
If you believe the exit value should be higher or the timeline shorter, make that case with data. Show comparable exits, market size analysis, and traction metrics that support higher projections. VCs will respect well-reasoned arguments even if they don't fully agree.
Conversely, understand that some valuation gaps are unbridgeable. If a VC models a $500 million exit and you're confident in $1.5 billion, you may have fundamentally different views of the opportunity. In such cases, finding investors who share your vision matters more than convincing skeptics.
For Investors
The VC Method provides a framework, not a formula. The best investors combine quantitative rigor with qualitative judgment. They stress-test assumptions, model multiple scenarios, and remain honest about uncertainty. They also recognize that valuation is only one term—governance rights, board composition, and investor-founder alignment often matter more for ultimate returns.
In competitive situations, investors sometimes stretch valuations above what their models strictly justify. This can be rational if it secures access to exceptional opportunities, but it requires explicit acknowledgment of the risk. Paying a $100 million pre-money when your model suggests $70 million means you're betting on better-than-modeled outcomes or accepting lower returns.
10 The Future of Venture Valuation Methodology
As venture capital matures as an asset class, valuation methodologies continue to evolve. Machine learning models now help investors analyze thousands of comparable companies and predict exit outcomes with greater accuracy. Real-time data on revenue growth, customer acquisition costs, and retention metrics enable more dynamic valuation adjustments.
However, the core logic of the VC Method—working backward from exit value to required ownership to current valuation—remains sound. The approach aligns investor incentives with fund economics and forces explicit discussion of the assumptions that drive returns. While the specific numbers will vary with market conditions, the framework endures.
In the current environment of 2025-2026, we're seeing a return to fundamentals after the excesses of 2020-2021. Valuations increasingly reflect realistic exit scenarios, sustainable growth rates, and capital efficiency. The companies that thrive will be those that understand these dynamics and build businesses worthy of the valuations they seek.
The VC Method ultimately reflects a simple truth: venture capital valuations are not about what a company is worth today, but about what ownership stake investors need to achieve their return targets given realistic exit scenarios. This forward-looking, return-driven approach will remain central to venture investing regardless of market conditions.
11 Conclusion: Mastering the Mathematics of Venture Returns
The Venture Capital Method represents more than a valuation technique—it embodies the fundamental economics of venture investing. By working backward from exit values and return requirements, the method forces discipline and transparency into what could otherwise be purely speculative pricing. Understanding this framework benefits everyone in the venture ecosystem.
For entrepreneurs, the VC Method explains why investors focus so intensely on exit potential and market size. A company with $10 million in revenue but a $50 billion addressable market commands higher valuations than one with identical revenue in a $500 million market, because the exit value potential differs by an order of magnitude. Similarly, capital efficiency matters enormously—companies that can reach exit with less dilution deliver better returns at any given valuation.
For investors, the method provides a structured approach to portfolio construction and return modeling. By explicitly modeling exit values, ownership targets, and dilution assumptions, VCs can build portfolios designed to achieve fund-level returns rather than optimizing individual investments in isolation. This portfolio perspective explains many decisions that seem puzzling at the company level.
The technical rigor required to properly apply the VC Method—modeling multiple scenarios, stress-testing assumptions, accounting for dilution and preferences—demands sophisticated analytical capabilities. Professional platforms like iValuate help investors and advisors perform these complex calculations efficiently, ensuring that valuations reflect sound methodology rather than guesswork. As venture markets continue to mature and professionalize, the ability to execute rigorous, defensible valuations becomes increasingly valuable.
Ultimately, venture capital valuations remain as much art as science. The VC Method provides the scientific framework, but judgment about team quality, market timing, and competitive dynamics determines whether the assumptions prove accurate. The best investors combine quantitative rigor with pattern recognition developed over hundreds of investments. They know when to trust their models and when to override them based on qualitative factors that spreadsheets can't capture.
As we navigate the venture landscape of 2025-2026, with its recalibrated expectations and return to fundamentals, the VC Method's emphasis on exit value and required returns feels more relevant than ever. The companies that succeed will be those that deliver the growth and outcomes that justify their valuations—and the investors who thrive will be those who accurately predict which companies can achieve those outcomes. The mathematics are unforgiving, but they're also clarifying, cutting through hype to reveal the economic realities that ultimately determine success or failure in venture capital.