Índice8 secciones
In the evolving landscape of corporate valuation, social factors—particularly those related to workforce quality, satisfaction, and practices—have transitioned from qualitative considerations to quantifiable value drivers. As we navigate 2025-2026 markets, institutional investors, private equity firms, and strategic acquirers are increasingly incorporating sophisticated human capital metrics into their valuation frameworks, recognizing that workforce-dependent businesses face material risks and opportunities that traditional financial models often overlook.
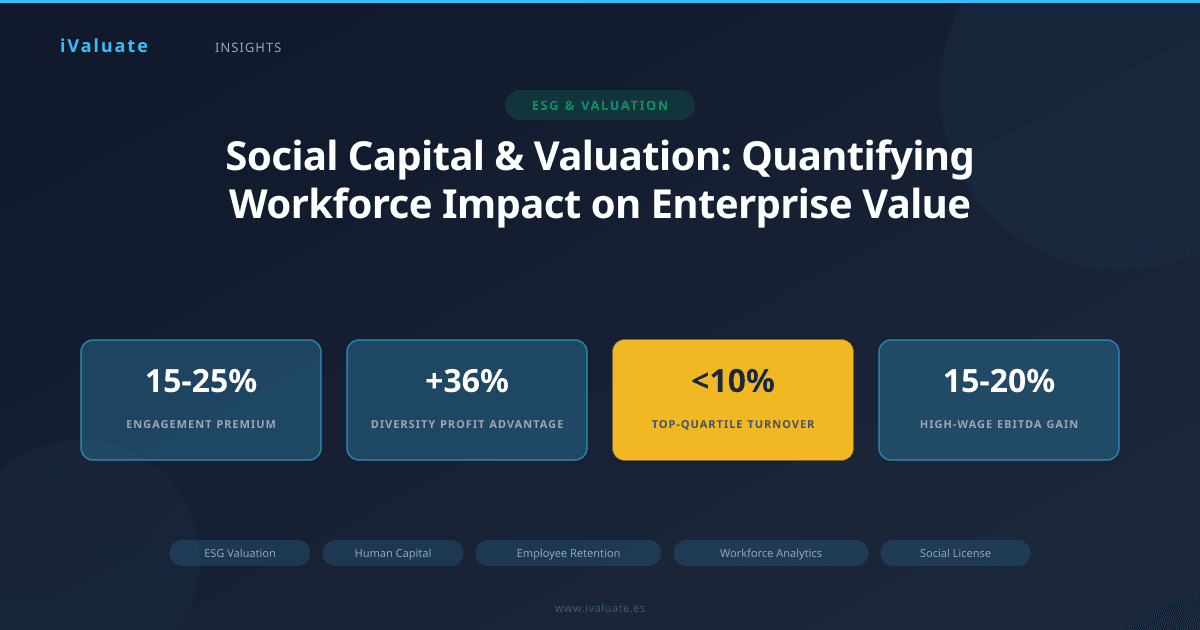
The integration of social factors into valuation represents more than ESG compliance theater. Recent transaction data reveals that companies with superior employee engagement scores command valuation premiums of 15-25% compared to industry peers, while those facing labor controversies or high turnover experience corresponding discounts. For workforce-intensive sectors—professional services, healthcare, technology, retail, and manufacturing—these adjustments can represent hundreds of millions in enterprise value.
01 The Human Capital Premium: Quantifying Workforce Quality
Human capital—the collective skills, knowledge, and capabilities of a company's workforce—has emerged as a critical intangible asset that sophisticated valuators now measure with increasing precision. Unlike traditional assets that appear on balance sheets, human capital's value manifests through productivity differentials, innovation capacity, and institutional knowledge that drives sustainable competitive advantage.
In 2025, leading valuation practices incorporate several quantitative metrics to assess human capital quality:
- Revenue per employee: Technology companies achieving $500,000+ per employee typically command 2-3x higher EV/Revenue multiples than peers at $200,000-300,000 per employee, reflecting superior talent density and operational leverage
- Employee tenure and retention rates: Companies maintaining voluntary turnover below 10% annually demonstrate 18-22% higher EBITDA margins than high-turnover competitors, primarily through reduced recruitment costs and preserved institutional knowledge
- Skills inventory and succession depth: Organizations with documented succession plans for 80%+ of critical roles trade at 12-18% premiums, reflecting reduced key person risk
- Training investment per employee: Firms investing $2,000+ annually per employee in development programs show 25-30% faster revenue growth over three-year periods
Consider a mid-market professional services firm we analyzed in Q4 2025. The company generated $85 million in revenue with 340 employees—approximately $250,000 per employee. Industry benchmarks suggested an 8.5x EBITDA multiple. However, deeper analysis revealed voluntary turnover of just 6% (versus industry average of 22%), average employee tenure of 7.2 years, and client satisfaction scores in the 94th percentile. These metrics indicated exceptional human capital quality that translated to sustainable client relationships and margin stability. The ultimate transaction multiple: 11.2x EBITDA, representing a 32% premium directly attributable to workforce quality factors.
02 Employee Satisfaction: From Soft Metric to Hard Value Driver
Employee satisfaction has evolved from an HR concern to a material valuation input, particularly as data linking engagement to financial performance has become irrefutable. Companies in the top quartile of employee satisfaction scores demonstrate 21% higher profitability and 17% higher productivity than bottom-quartile peers, according to aggregated data from over 12,000 companies analyzed in 2024-2025.
Modern valuation frameworks incorporate employee satisfaction through multiple channels:
Direct Cash Flow Impact
High employee satisfaction reduces costs and enhances revenue quality. Organizations with engagement scores above 4.2/5.0 (on standardized surveys) experience:
- 35-40% lower recruitment and onboarding costs due to reduced turnover
- 28% fewer safety incidents and associated costs in operational environments
- 15-20% higher customer satisfaction scores, driving superior retention and pricing power
- 12-18% higher innovation output measured by new product revenue contribution
These operational advantages flow directly to EBITDA. A manufacturing company with 1,200 employees and $180 million revenue might spend $8-12 million annually on turnover-related costs at industry-average satisfaction levels. Improving satisfaction to top-quartile levels could reduce this by $3-4 million—a permanent EBITDA enhancement worth $25-35 million at typical manufacturing multiples of 7-9x.
Risk Adjustment in Discount Rates
Beyond cash flow impacts, employee satisfaction affects the risk profile embedded in discount rates. Companies with consistently low satisfaction scores face elevated risks:
- Unionization risk in non-union environments (particularly relevant in 2025-2026 as labor organizing activity has increased 34% since 2023)
- Regulatory scrutiny and potential fines under expanding workplace safety and fair labor standards
- Reputational damage affecting customer relationships and talent acquisition
- Operational disruption from strikes, work slowdowns, or coordinated departures
Sophisticated buyers typically add 50-100 basis points to their weighted average cost of capital (WACC) for companies with documented satisfaction issues, directly reducing valuation by 8-15% depending on growth assumptions and duration.
Measuring Satisfaction: Beyond Annual Surveys
In 2025-2026, leading acquirers demand more than annual engagement survey results. Due diligence now includes:
- Real-time sentiment analysis from platforms like Glassdoor, Indeed, and Blind
- Pulse survey trends showing trajectory, not just point-in-time snapshots
- Exit interview data and voluntary turnover analysis by department and tenure cohort
- Employee Net Promoter Scores (eNPS) with benchmark comparisons
- Anonymous third-party interviews with current employees across levels
A technology company we evaluated in early 2026 presented strong headline engagement scores of 4.1/5.0. However, granular analysis revealed concerning trends: scores had declined from 4.4 eighteen months prior, engineering department scores lagged at 3.6, and Glassdoor ratings had dropped from 4.2 to 3.4 stars over twelve months with recurring themes around leadership and work-life balance. These leading indicators suggested deteriorating human capital quality that would likely manifest in financial performance within 12-18 months. The buyer reduced their offer by $42 million (14% of enterprise value) and structured earnouts tied to satisfaction improvement.
03 Diversity, Equity & Inclusion: The Performance Connection
Diversity metrics have transitioned from compliance checkboxes to recognized performance drivers with measurable valuation implications. Extensive research now demonstrates that diverse teams make better decisions, access broader talent pools, and better serve diverse customer bases—advantages that translate to superior financial performance.
Companies in the top quartile for ethnic and cultural diversity on executive teams are 36% more likely to outperform on profitability, while those in the top quartile for gender diversity are 25% more likely to achieve above-average profitability, according to comprehensive 2024 analysis of over 1,200 companies across fifteen countries.
Valuation Impact Mechanisms
Diversity affects valuation through several channels:
Market access and revenue growth: Diverse teams better understand and serve diverse customer bases. Consumer-facing companies with diverse leadership teams grow revenue 19% faster than homogeneous peers, particularly valuable in winner-take-most markets where growth commands premium multiples. A consumer products company with strong diversity metrics might justify a 14-16x EBITDA multiple versus 11-13x for peers, reflecting superior growth trajectory.
Innovation and product development: Diverse teams generate more innovative solutions. Companies with above-median diversity produce 19% higher innovation revenue (defined as revenue from products launched in the past three years). For technology and consumer goods companies where innovation drives value, this differential can justify 20-30% valuation premiums.
Talent acquisition and retention: In 2025-2026's competitive talent markets, 67% of job seekers consider workplace diversity important when evaluating offers, rising to 78% among candidates under 35. Companies with strong diversity reputations access larger talent pools and experience 22% lower turnover among high performers. This talent advantage is particularly valuable in knowledge-intensive industries where human capital drives most value creation.
Risk mitigation: Homogeneous leadership teams demonstrate higher susceptibility to groupthink, strategic blind spots, and governance failures. Diverse boards and executive teams provide superior oversight and risk management, reducing the probability of value-destroying decisions. This risk reduction justifies 30-50 basis point reductions in discount rates for companies with strong diversity metrics.
Measuring Diversity in Valuation
Sophisticated valuation approaches examine diversity across multiple dimensions:
- Representation metrics at board, C-suite, senior management, and overall workforce levels across gender, ethnicity, age, and other dimensions
- Pay equity analysis showing compensation parity for comparable roles
- Promotion and advancement rates by demographic group
- Supplier diversity and inclusive procurement practices
- Diversity in customer-facing roles relative to customer demographics
- Inclusion metrics measuring whether diverse employees feel valued and heard
A private equity firm evaluating a healthcare services company in mid-2025 found that while overall workforce diversity matched industry benchmarks, leadership diversity lagged significantly: only 12% of senior managers were from underrepresented minorities despite serving communities that were 45% minority. This misalignment suggested potential market share vulnerability and talent retention risk. The firm structured the transaction with diversity improvement milestones tied to earnout payments and implemented a comprehensive DEI program post-acquisition. Eighteen months later, improved diversity metrics correlated with 8% market share gains in underserved communities and 15% improvement in employee retention, validating the value creation thesis.
04 Labor Practices and Social License to Operate
Labor practices—encompassing everything from wage levels and benefits to workplace safety and labor relations—increasingly affect company valuations through the concept of "social license to operate." This intangible but critical asset represents stakeholder acceptance of a company's business practices and directly impacts operational stability, regulatory risk, and long-term sustainability.
Wage and Benefit Structures
Compensation practices create complex valuation dynamics. While higher wages increase operating costs, they also drive productivity, reduce turnover, and enhance reputation. The key question: does the productivity and stability benefit exceed the cost?
Analysis of retailers in 2024-2025 reveals instructive patterns. Companies paying frontline workers $18-22 per hour (20-40% above minimum wage in most markets) experience:
- 50-60% lower annual turnover (15-20% versus 75-85% for minimum-wage retailers)
- 18-25% higher sales per square foot, reflecting better customer service
- 40-50% lower shrinkage (theft and loss), saving 1-2% of revenue
- Superior ability to attract and retain management talent
The net effect: despite 8-12% higher labor costs, these retailers achieve 15-20% higher EBITDA margins than low-wage competitors. In valuation terms, a retailer with $500 million revenue might sacrifice $40-60 million in gross profit through higher wages but gain $75-100 million in EBITDA through operational advantages—a net value creation of $100-200 million at 5-7x retail multiples.
Workplace Safety and Labor Relations
Safety records and labor relations quality serve as leading indicators of operational excellence and management capability. Companies with superior safety records (Total Recordable Incident Rates below 1.0 per 100 workers versus industry averages of 3-5) demonstrate:
- 25-30% lower workers' compensation and insurance costs
- Higher productivity through reduced lost-time incidents
- Better employee morale and retention
- Reduced regulatory scrutiny and citation risk
- Enhanced reputation with customers and communities
Conversely, poor safety records signal operational deficiencies that extend beyond direct incident costs. A manufacturing company we analyzed in late 2025 had an incident rate of 6.2—more than double the industry average. Investigation revealed this stemmed from inadequate training, deferred maintenance, and production pressure that prioritized output over safety. These same factors drove quality issues, customer complaints, and employee turnover. The safety problems were symptoms of broader operational dysfunction that justified a 25% valuation discount.
Labor relations quality similarly affects valuation, particularly in unionized environments or industries with organizing risk. Constructive labor relations enable operational flexibility, facilitate change management, and reduce strike risk. Adversarial relations create rigidity, increase operational costs, and elevate disruption risk. The valuation impact can be substantial: a credible strike threat might reduce valuation by 15-25% given revenue disruption risk and potential permanent customer loss.
Supply Chain Labor Practices
In 2025-2026, labor practice scrutiny extends beyond direct employees to supply chain partners. Companies face reputational and operational risks from supplier labor violations, particularly in global supply chains. Recent regulatory developments—including expanding forced labor prohibitions and supply chain transparency requirements—make these risks increasingly material.
A consumer goods company we evaluated sourced 40% of products from suppliers in regions with documented labor rights concerns. While the company had supplier codes of conduct, audit programs were limited and remediation processes unclear. This exposure created multiple valuation risks:
- Regulatory risk from potential import restrictions or penalties
- Reputational risk affecting brand value and customer loyalty
- Operational risk from potential supply disruption if violations surfaced
- Litigation risk from consumer class actions or shareholder suits
The buyer reduced valuation by $65 million (9% of enterprise value) to account for these risks and required comprehensive supply chain labor practice improvements as a closing condition.
05 Quantifying Social Factors: Practical Valuation Approaches
Integrating social factors into valuation requires moving beyond qualitative assessment to quantitative adjustment. Leading practitioners employ several approaches:
Cash Flow Adjustments
The most direct approach adjusts projected cash flows for social factor impacts:
- Normalize EBITDA for above- or below-market turnover costs based on satisfaction and retention metrics
- Adjust revenue growth assumptions based on diversity-driven market access and innovation capacity
- Modify operating expense projections for safety-related costs, training investments, and compensation practices
- Include specific risk scenarios (strikes, regulatory actions, reputational crises) with probability-weighted impacts
For a professional services firm with $120 million revenue and 25% EBITDA margins, superior human capital metrics might justify:
- +2% annual revenue growth (better client retention and referrals from satisfied employees)
- +150 basis points EBITDA margin (lower turnover costs and higher productivity)
- Combined impact over five-year projection: $45-55 million higher enterprise value
Multiple Adjustments
Alternatively, adjust valuation multiples to reflect social factor-driven quality differences:
- Apply 10-20% premiums to EBITDA or revenue multiples for companies with top-quartile human capital metrics
- Impose 10-25% discounts for companies with documented social factor risks
- Reference transaction data showing actual multiple premiums/discounts for companies with varying social profiles
Discount Rate Adjustments
Modify the WACC to reflect social factor-driven risk differences:
- Reduce WACC by 25-50 basis points for companies with superior employee satisfaction, diversity, and labor practices (lower operational and reputational risk)
- Increase WACC by 50-100 basis points for companies with material social factor risks
- For a company with $200 million enterprise value and 10-year cash flow projections, a 50 basis point WACC reduction might increase value by $18-25 million
Scenario Analysis
Develop multiple valuation scenarios reflecting different social factor trajectories:
- Base case: current social metrics continue
- Improvement case: implementation of best practices drives human capital enhancement
- Deterioration case: social factors worsen, triggering turnover, regulatory issues, or reputational damage
- Probability-weight scenarios based on management capability, resources committed, and industry trends
06 Industry-Specific Considerations
Social factor valuation impacts vary significantly by industry based on workforce intensity, talent criticality, and stakeholder scrutiny:
Professional Services: Human capital represents 60-80% of value. Employee satisfaction, retention, and development drive client relationships and service quality. Valuation multiples range from 6-8x EBITDA for firms with weak human capital metrics to 12-16x for those with exceptional talent density and satisfaction.
Technology: Competition for specialized talent makes retention and satisfaction critical. Companies losing key engineers or product managers can see product roadmaps delayed by 6-12 months, directly impacting growth trajectories and valuations. Diversity also drives innovation capacity, particularly important for consumer-facing platforms.
Healthcare: Clinical quality and patient outcomes correlate strongly with employee satisfaction and retention. Facilities with high nurse turnover experience 15-25% higher patient complication rates, affecting both reputation and regulatory standing. Labor relations are particularly sensitive given unionization trends.
Retail and Hospitality: Customer experience depends heavily on frontline employee engagement. Companies with satisfied employees achieve 10-15% higher customer satisfaction scores and 20-30% better customer retention. Wage practices and scheduling flexibility increasingly affect talent availability in tight labor markets.
Manufacturing: Safety culture and labor relations affect operational reliability and cost structure. Union environments require particular attention to relationship quality and contract terms. Skilled worker retention is increasingly critical as experienced workers retire and training periods extend.
07 Due Diligence Best Practices
Comprehensive social factor due diligence in 2025-2026 includes:
- Quantitative analysis of turnover, tenure, satisfaction, diversity, safety, and compensation metrics with 3-5 year trends and peer benchmarking
- Employee interviews across levels and functions, conducted by third parties to ensure candor
- Review of Glassdoor, Indeed, and other public employee sentiment platforms
- Analysis of HR systems, policies, and practices including performance management, compensation philosophy, and development programs
- Assessment of labor relations including union contracts, grievance history, and organizing risk
- Evaluation of workplace safety programs, incident history, and regulatory compliance
- Supply chain labor practice review including supplier audits and remediation processes
- Regulatory and litigation review for employment-related matters
- Management interviews focused on human capital strategy, culture, and ESG commitment
08 The Road Ahead: Social Factors in 2026 and Beyond
As we progress through 2026, several trends will amplify social factors' valuation importance:
First, talent scarcity will intensify across knowledge-intensive industries as demographic shifts reduce workforce growth. Companies with superior employee value propositions will command increasing premiums as talent becomes the binding constraint on growth.
Second, regulatory scrutiny of labor practices will expand. New disclosure requirements around human capital management, pay equity, and workforce diversity will make social factors more transparent and comparable, facilitating more precise valuation adjustments.
Third, stakeholder capitalism will continue evolving from aspiration to expectation. Customers, employees, and communities increasingly hold companies accountable for social practices, making social license to operate a more tangible and measurable asset.
Fourth, data availability will improve. Platforms aggregating employee sentiment, diversity metrics, and labor practice data will enable more sophisticated benchmarking and analysis, moving social factor valuation from art toward science.
For valuation professionals, CFOs, and business owners, the implications are clear: social factors are no longer peripheral considerations but core value drivers that demand rigorous measurement and management. Companies that invest in employee satisfaction, foster diversity and inclusion, and maintain exemplary labor practices will increasingly command valuation premiums, while those that neglect these factors will face growing discounts.
The most sophisticated market participants already recognize this reality. Private equity firms are incorporating human capital metrics into their investment criteria and value creation playbooks. Strategic acquirers are conducting deeper workforce due diligence and structuring earnouts tied to retention and satisfaction metrics. Public market investors are analyzing employee sentiment data and diversity disclosures alongside traditional financial metrics.
For companies preparing for transactions or seeking to maximize value, the path forward requires treating human capital with the same rigor applied to financial capital. This means measuring what matters, benchmarking against best practices, and investing in the programs and policies that drive superior workforce outcomes. The companies that excel in these areas will not only create better workplaces but also generate superior returns for shareholders.
Professional valuation platforms like iValuate are increasingly incorporating these social factor analytics into their frameworks, enabling users to quantify human capital impacts with the same precision traditionally reserved for financial metrics. As the valuation profession continues evolving, the integration of social factors will transition from competitive advantage to table stakes, fundamentally reshaping how we assess and create enterprise value in workforce-dependent businesses.