Índice7 secciones
Real estate investment trusts (REITs) and property companies represent a unique asset class that requires specialized valuation methodologies distinct from traditional corporate finance approaches. Unlike operating companies valued primarily on earnings or cash flow multiples, property companies derive value from their underlying real estate assets, rental income streams, and portfolio quality. As institutional allocations to real estate have grown to represent 10-15% of diversified portfolios in 2025, understanding the nuanced valuation frameworks for this sector has become essential for investment professionals.
The valuation of REITs and property companies centers on three interconnected methodologies: Net Asset Value (NAV) analysis, Funds From Operations (FFO) multiples, and capitalization rate (cap rate) frameworks. Each approach provides distinct insights into value creation, and sophisticated investors employ all three in combination to triangulate fair value estimates. This article examines these methodologies in depth, providing the technical rigor and practical application frameworks that professionals require.
01 Understanding Net Asset Value (NAV) in Real Estate Valuation
Net Asset Value represents the fundamental building block of property company valuation. NAV calculates the fair market value of a company's real estate portfolio, subtracts all liabilities, and divides by shares outstanding to arrive at a per-share intrinsic value. This bottom-up approach provides a direct link between property values and equity value, making it the preferred methodology for asset-heavy REITs and property companies.
The NAV Calculation Framework
The standard NAV calculation follows this structure:
- Gross Asset Value: Fair market value of all properties (typically derived from independent appraisals or internal valuations using discounted cash flow models)
- Less: Net Debt: Total debt minus cash and cash equivalents
- Less: Other Liabilities: Deferred tax liabilities, derivatives at fair value, and other obligations
- Add: Other Assets: Investments in associates, development pipelines at fair value
- Equals: Net Asset Value
- Divide by: Fully Diluted Shares Outstanding
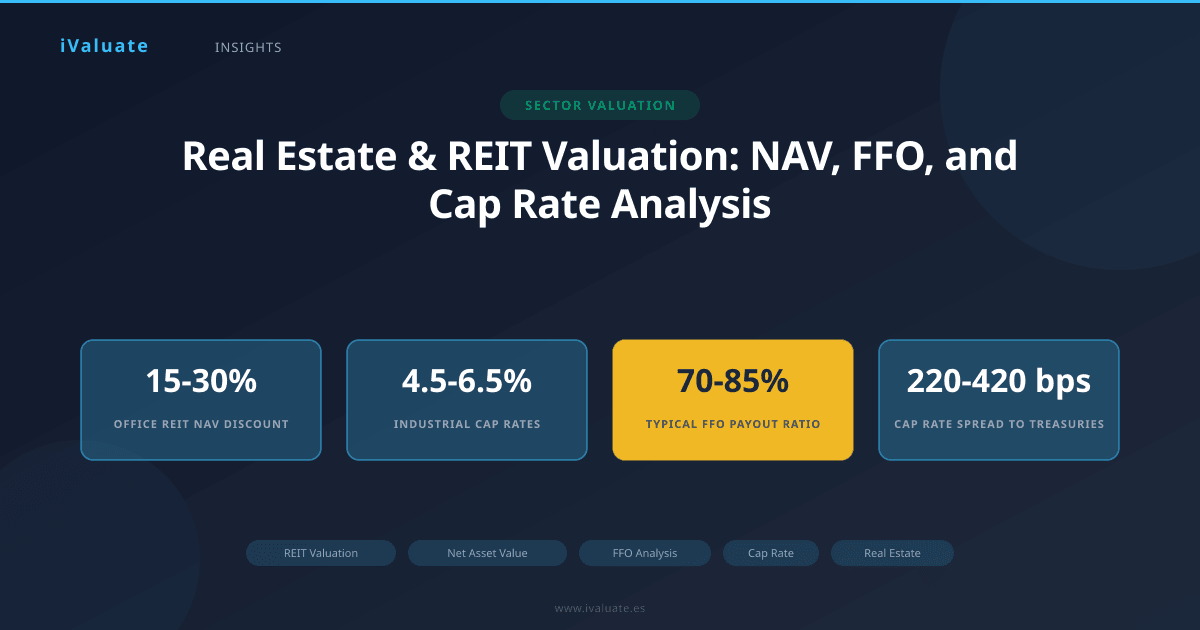
The sophistication lies in the property valuation component. Most publicly traded REITs report IFRS or GAAP fair values based on external appraisals conducted semi-annually or annually. These appraisals typically employ discounted cash flow analysis, with discount rates ranging from 6-9% for stabilized assets and 8-12% for value-add properties in current market conditions. For office properties in gateway cities, appraisers are applying exit cap rates of 5.5-7.0%, while industrial and logistics assets command 4.5-6.5% cap rates reflecting strong fundamentals.
EPRA NAV Metrics: The Industry Standard
The European Public Real Estate Association (EPRA) has established standardized NAV metrics that have become global best practice. As of 2025, the framework includes three primary measures:
EPRA Net Reinstatement Value (NRV): Assumes entities never sell assets, representing the value required to rebuild the portfolio. This metric includes real estate transfer taxes and other acquisition costs, typically adding 6-8% to gross asset values in European markets. NRV is most relevant for long-term hold strategies and closed-end funds.
EPRA Net Tangible Assets (NTA): Assumes entities buy and sell assets in the normal course of business, excluding items not expected to crystallize in normal circumstances. This has become the primary NAV metric for most analysts, as it reflects realistic assumptions about portfolio management. NTA typically excludes deferred tax on property revaluations and goodwill.
EPRA Net Disposal Value (NDV): Represents liquidation value, including all costs associated with selling the entire portfolio. This metric deducts real estate transfer taxes and includes deferred tax liabilities at full statutory rates. NDV typically trades at a 15-25% discount to NTA, reflecting the friction costs of portfolio liquidation.
Premium/Discount to NAV Analysis
Public REITs rarely trade at precisely their NAV. The premium or discount reflects market sentiment, management quality, liquidity, dividend yield, and growth prospects. In the current market environment, we observe distinct patterns:
- Industrial and logistics REITs: Trading at 5-15% premiums to NAV, reflecting strong e-commerce tailwinds and limited supply in key markets
- Residential REITs: Trading near NAV (±5%), with affordable housing operators commanding premiums while luxury segments trade at discounts
- Office REITs: Trading at 15-30% discounts to NAV, particularly for older Class B/C assets facing structural headwinds from hybrid work
- Retail REITs: Bifurcated market with grocery-anchored and necessity retail at slight premiums, while mall REITs trade at 20-35% discounts
A persistent 20%+ discount to NAV often signals either market skepticism about reported property values, concerns about management's capital allocation, or structural challenges in the underlying property sector. Conversely, sustained premiums typically reflect superior management, embedded growth options, or scarcity value in high-quality portfolios.
02 Funds From Operations (FFO): The REIT Earnings Metric
Traditional earnings metrics prove inadequate for REITs because depreciation—a major non-cash expense—bears little relationship to the economic reality of well-maintained real estate, which often appreciates over time. The National Association of Real Estate Investment Trusts (NAREIT) developed FFO as a standardized performance measure that better reflects REIT operating performance.
FFO Calculation and Variations
The standard FFO calculation starts with GAAP net income and makes the following adjustments:
- Add back: Real estate depreciation and amortization
- Add back: Impairment charges on real estate assets
- Subtract: Gains on sales of real estate (or add back losses)
- Adjust for: Unconsolidated partnerships and joint ventures
However, FFO has evolved into several variants that provide additional analytical value:
Adjusted Funds From Operations (AFFO): Also called Cash Available for Distribution (CAD), AFFO refines FFO by subtracting normalized recurring capital expenditures and straight-line rent adjustments. This metric better approximates distributable cash flow. AFFO typically runs 8-15% below FFO, with the gap wider for older properties requiring more capital investment. For a typical office REIT, AFFO might be calculated as FFO minus $2.50-4.00 per square foot in recurring capex and tenant improvements.
Core FFO: Many REITs report Core FFO, which excludes one-time items, transaction costs, and other non-recurring expenses. This metric facilitates year-over-year comparisons and helps investors focus on sustainable operating performance. In 2025, common exclusions include debt refinancing costs, severance expenses, and costs associated with property repositioning.
FFO Multiple Valuation Framework
FFO multiples provide a relative valuation framework analogous to P/E ratios for operating companies. The Price-to-FFO multiple (or EV-to-FFO for enterprise value perspectives) varies significantly by property type and growth profile:
- High-growth data center REITs: 22-28x FFO, reflecting 8-12% annual FFO growth expectations
- Industrial/logistics REITs: 18-24x FFO, supported by 5-8% growth profiles
- Residential REITs: 16-22x FFO, with sunbelt operators commanding premium multiples
- Net lease REITs: 12-16x FFO, reflecting stable but limited growth
- Office REITs: 8-14x FFO, with significant dispersion based on portfolio quality and location
The FFO multiple framework incorporates several value drivers beyond growth. Dividend yield plays a crucial role, as REITs must distribute at least 90% of taxable income to maintain their tax status. A REIT trading at 20x FFO with a 4.5% dividend yield offers a different risk-return profile than one at 15x FFO yielding 6.0%. The FFO payout ratio (dividends divided by FFO) typically ranges from 70-85%, with lower ratios indicating greater financial flexibility and retained cash for growth investments.
Case Study: Industrial REIT Valuation Convergence
Consider a hypothetical industrial REIT that reported $3.20 FFO per share in 2024 and trades at $62 per share. The 19.4x FFO multiple appears reasonable given the sector median of 20x. However, deeper analysis reveals the company's same-store NOI growth of 4.2% lags peers achieving 6-8%, and its development pipeline represents only 3% of gross asset value versus peer averages of 8-10%. The company's AFFO of $2.85 per share (after $0.35 in recurring capex) supports its $2.40 dividend, providing an 84% payout ratio that limits financial flexibility.
Relative to NAV of $68 per share, the stock trades at a 9% discount, modest for the sector. However, when analysts adjust NAV for potentially aggressive cap rate assumptions on older facilities (applying 5.5% versus appraised 5.0% cap rates), adjusted NAV falls to $64, narrowing the discount to 3%. This convergence analysis—comparing FFO multiples, dividend yields, and NAV premiums/discounts—provides a comprehensive valuation framework suggesting the shares are fairly valued with limited upside absent operational improvements.
03 Capitalization Rate Analysis: The Property-Level Foundation
Capitalization rates (cap rates) represent the foundational metric in real estate valuation, expressing the relationship between a property's net operating income and its value. The cap rate serves as both a valuation input and an output metric, providing insights into required returns, risk perceptions, and relative value across markets and property types.
Cap Rate Fundamentals and Calculation
The cap rate formula appears deceptively simple:
Cap Rate = Net Operating Income / Property Value
Or inversely: Property Value = Net Operating Income / Cap Rate
Net Operating Income (NOI) represents property-level cash flow before debt service, calculated as rental revenue plus other income, minus operating expenses (property taxes, insurance, maintenance, property management). Critically, NOI excludes depreciation, interest expense, and capital expenditures, focusing purely on stabilized operating performance.
A property generating $5 million in NOI valued at $80 million implies a 6.25% cap rate. If market cap rates compress to 5.75%, the same NOI stream justifies an $87 million valuation—a 9% increase with no change in operations. This sensitivity to cap rate movements drives significant volatility in REIT NAVs during interest rate cycles.
Cap Rate Determinants and Market Dynamics
Cap rates reflect multiple risk and return factors:
Risk-Free Rate Foundation: Cap rates typically trade at spreads to 10-year government bonds, with the spread representing real estate risk premium. In early 2025, with 10-year Treasuries at 4.3%, prime office cap rates of 6.5% imply a 220 basis point spread, while secondary office assets at 8.5% cap rates reflect 420 basis points of additional risk premium. Historically, these spreads average 250-350 basis points, suggesting current pricing reflects elevated risk perceptions for office assets.
Property Type and Quality: Cap rates vary dramatically by asset class. Current market data shows:
- Class A industrial in primary markets: 4.5-5.5%
- Class A multifamily in gateway cities: 4.8-5.8%
- Grocery-anchored retail: 6.0-7.0%
- Class A office in CBDs: 5.5-7.0%
- Class B/C office: 7.5-9.5%
- Single-tenant net lease: 5.5-7.5% (varies by tenant credit)
Growth Expectations: Cap rates incorporate implied NOI growth assumptions. A property with 3% annual rent growth might trade at a 5.5% cap rate, while a similar property with flat or declining rents might require a 7.5% cap rate to attract buyers. The Gordon Growth Model relationship (Cap Rate = Discount Rate - Growth Rate) provides theoretical grounding for this relationship.
Market Liquidity and Transaction Volume: Cap rates derived from actual transactions provide the most reliable market evidence. In 2024-2025, transaction volumes declined 25-30% from peak levels as the bid-ask spread widened. Sellers anchored to 2021-2022 valuations resist cap rate expansion, while buyers demand higher returns to compensate for interest rate and economic uncertainty. This standoff compresses transaction volumes and can make cap rate discovery challenging.
Going-In vs. Exit Cap Rates in DCF Analysis
Sophisticated property valuations employ discounted cash flow models that distinguish between going-in cap rates (current NOI divided by current value) and exit cap rates (projected NOI at sale divided by projected sale price). The exit cap rate typically exceeds the going-in cap rate by 25-75 basis points, reflecting property aging and market risk over the hold period.
For example, a value-add office repositioning might assume:
- Acquisition at 7.5% going-in cap rate
- Three-year business plan to renovate and re-lease
- Stabilized NOI growth from $6 million to $8.5 million
- Exit at 7.0% cap rate (reflecting improved quality but market normalization)
- Discount rate of 9.5% reflecting execution risk
This framework would justify an acquisition price of $80 million and project an exit value of $121 million, generating a 15% IRR including cash flows during the hold period. The 50 basis point cap rate compression from 7.5% to 7.0% contributes meaningfully to returns, but the primary value creation derives from NOI growth through active asset management.
04 Integrating the Three Methodologies: A Comprehensive Framework
Sophisticated REIT and property company valuation requires synthesizing NAV, FFO multiples, and cap rate analysis into a coherent framework. Each methodology provides distinct insights, and their convergence (or divergence) signals important investment implications.
The Valuation Triangle Approach
Professional analysts construct a "valuation triangle" that examines:
Bottom-Up NAV Analysis: Build detailed property-by-property valuations using current market cap rates, adjust for debt and other assets/liabilities, and calculate NAV per share. Stress test assumptions by flexing cap rates ±25-50 basis points to understand valuation sensitivity. For a diversified REIT, a 50 basis point cap rate expansion might reduce NAV by 8-12%.
Top-Down FFO Multiple Analysis: Compare the company's FFO multiple to sector peers, adjusting for growth differentials, balance sheet strength, and portfolio quality. Calculate an implied price target based on peer multiples and projected FFO. Reconcile any significant divergence between FFO-implied value and NAV.
Dividend Discount Model: Project dividends based on FFO growth assumptions and payout ratios, and discount at an appropriate cost of equity (typically 7-10% depending on risk profile). This provides a third valuation perspective grounded in cash distributions to shareholders.
When all three methodologies converge within a 10-15% range, confidence in the valuation increases substantially. Significant divergence demands investigation—perhaps the market anticipates cap rate movements not yet reflected in appraisals, or FFO multiples reflect growth expectations not captured in static NAV calculations.
Real-World Application: Retail REIT Restructuring
Consider a regional mall REIT that illustrates the power of integrated analysis. In early 2024, the company traded at $28 per share against reported NAV of $42, a 33% discount. The 11x FFO multiple appeared cheap relative to the broader REIT market at 17x, and the 8.5% dividend yield attracted income-focused investors.
However, deeper analysis revealed concerning dynamics. The company's mall properties were appraised at 7.5% cap rates, but recent transactions of comparable malls occurred at 9-10% cap rates. Adjusting the portfolio to 9.0% cap rates reduced NAV to $34 per share, narrowing the discount to 18%. Furthermore, same-store NOI declined 2.1% in 2023 as anchor tenant departures pressured rents, and occupancy fell to 88% from 93% two years prior.
The FFO multiple appeared cheap, but FFO of $2.55 per share was inflated by one-time termination fees and declining depreciation on fully depreciated assets. Adjusted FFO of $2.30 implied a 12.2x multiple, less compelling. Most critically, the $2.40 dividend represented a 104% payout ratio on adjusted FFO, clearly unsustainable. The company subsequently cut its dividend by 40% in late 2024, and shares fell to $22 before stabilizing.
This case demonstrates why integrated analysis matters. Investors focused solely on NAV discount or FFO yield missed the deteriorating fundamentals and unsustainable capital structure. Comprehensive analysis examining cap rate trends, FFO quality, and dividend sustainability would have identified the value trap.
05 Advanced Considerations in REIT Valuation
Development Pipelines and Value Creation
REITs with significant development pipelines require additional valuation considerations. Development projects typically appear in NAV at cost until completion and stabilization, potentially understating value if projects will stabilize at yields exceeding the REIT's cost of capital. A development project costing $100 million that generates $7.5 million in stabilized NOI creates value if the REIT's portfolio cap rate is 6.0%—the completed project would be worth $125 million.
Analysts often calculate "development NAV" by valuing projects at expected stabilized cap rates rather than cost. However, this requires careful risk adjustment for lease-up uncertainty, construction delays, and cost overruns. A 50-100 basis point cap rate premium to stabilized portfolio assets typically reflects appropriate risk adjustment for development projects.
Interest Rate Sensitivity and Duration Analysis
REITs exhibit bond-like duration characteristics due to their high dividend yields and sensitivity to cap rate movements. When interest rates rise, cap rates typically follow (though with a lag), compressing NAV. Simultaneously, higher rates reduce the present value of future dividends, pressuring FFO multiples. This double impact explains why REITs often decline 15-25% during rapid rate increase cycles.
The sensitivity varies by property type. Long-lease assets (net lease, healthcare) with fixed rents exhibit higher duration and greater rate sensitivity. Conversely, multifamily and hotel REITs with short-term leases can adjust rents more quickly, providing some inflation protection and reducing duration.
Geographic and Tenant Concentration Risks
NAV and FFO analysis must incorporate concentration risks. A REIT with 40% of NOI from a single metropolitan area faces geographic concentration risk that warrants a valuation discount. Similarly, tenant concentration—particularly in net lease or office REITs—creates cash flow risk if major tenants default or fail to renew. Analysts typically apply 5-15% NAV discounts for material concentration risks not present in diversified peer portfolios.
06 Current Market Environment and Forward Outlook
The 2024-2025 period has presented unique challenges for REIT valuation. Following the rapid interest rate increases of 2022-2023, cap rates expanded 100-150 basis points across most property types, compressing NAVs by 15-20% on average. Transaction volumes declined sharply as buyers and sellers struggled to agree on appropriate cap rates amid economic uncertainty.
However, differentiation has intensified. Industrial and data center REITs maintained relatively stable valuations, with cap rates expanding only 50-75 basis points, as structural demand drivers offset rate headwinds. Conversely, office REITs faced dual pressures from rate increases and fundamental deterioration, with cap rates expanding 200-300 basis points and NAVs declining 30-40%.
Looking forward to 2025-2026, several dynamics will shape REIT valuations:
Interest Rate Stabilization: With the Federal Reserve potentially concluding its tightening cycle, cap rates may stabilize or even compress modestly if rates decline. Each 50 basis point decline in long-term rates could drive 5-8% NAV appreciation, all else equal.
Operating Fundamentals: Rental growth remains positive for industrial (4-6%), multifamily (3-5%), and certain retail formats (2-4%), supporting FFO growth. Office fundamentals remain challenged, with negative absorption continuing in most markets.
Capital Markets Access: REITs with strong balance sheets and investment-grade ratings can access capital at reasonable costs, enabling acquisitions of distressed assets from overleveraged private owners. This creates external growth opportunities beyond organic same-store NOI growth.
Private Market Repricing: As private real estate funds mark portfolios to market, the bid-ask spread should narrow, increasing transaction volumes and improving cap rate price discovery. This benefits public REITs by reducing NAV uncertainty.
The current environment rewards rigorous, bottoms-up analysis. REITs trading at significant NAV discounts may represent value opportunities if cap rates stabilize, but only if underlying property fundamentals remain sound. Conversely, REITs at NAV premiums must demonstrate clear growth pathways and superior management to justify premium valuations.
07 Conclusion: Mastering the REIT Valuation Toolkit
Real estate and REIT valuation demands specialized expertise that integrates property-level analysis, corporate finance principles, and market dynamics. The three core methodologies—NAV analysis, FFO multiples, and cap rate frameworks—provide complementary perspectives that, when synthesized effectively, generate robust valuation conclusions.
NAV analysis grounds valuation in underlying asset values, providing a tangible reference point and downside protection measure. FFO multiples enable relative valuation and incorporate market expectations for growth and management quality. Cap rate analysis connects property-level economics to portfolio values and provides sensitivity analysis for interest rate scenarios.
Success in REIT valuation requires moving beyond simplistic metrics to understand the drivers of value creation: portfolio quality, management's capital allocation track record, balance sheet strength, and alignment with structural real estate trends. The bifurcation in REIT performance—with industrial and residential operators thriving while office REITs struggle—underscores the importance of property-type expertise and forward-looking fundamental analysis.
For professionals conducting regular REIT valuations, efficiency and analytical rigor are paramount. Platforms like iValuate enable sophisticated analysis by automating data collection, standardizing calculation methodologies, and facilitating scenario analysis across multiple valuation frameworks. As the real estate sector continues evolving in response to technological change, demographic shifts, and economic cycles, the professionals who master these analytical tools will identify opportunities others miss and provide superior advice to clients navigating this complex asset class.
The integration of NAV, FFO, and cap rate analysis represents more than technical proficiency—it reflects a comprehensive understanding of how real estate creates value, how markets price that value, and how investors can identify mispricings. In an environment where public REITs provide liquid access to institutional-quality real estate, and where private market repricing creates opportunity, this analytical framework has never been more essential.