Índice12 secciones
Valuing pre-revenue startups remains one of the most challenging exercises in corporate finance. Unlike established companies with historical financials, revenue multiples, and comparable transactions, early-stage ventures require fundamentally different analytical frameworks. In the current market environment of 2025-2026, where seed-stage funding has contracted approximately 32% from 2021 peaks yet quality deals continue to command premium valuations, understanding these specialized methodologies has never been more critical.
This article examines the three dominant pre-revenue valuation methods employed by sophisticated angel investors, seed funds, and early-stage venture capitalists: the Scorecard Method, the Berkus Method, and Risk Factor Summation. Each framework addresses the fundamental challenge of assigning monetary value to companies with minimal operating history, no revenue, and uncertain market traction.
01 The Fundamental Challenge of Pre-Revenue Valuation
Traditional valuation approaches—discounted cash flow analysis, comparable company multiples, precedent transactions—all rely on financial performance metrics that pre-revenue startups simply don't possess. A seed-stage software company with three co-founders, a prototype, and 200 beta users has no EBITDA to multiply, no revenue to discount, and often no truly comparable peers that have recently transacted.
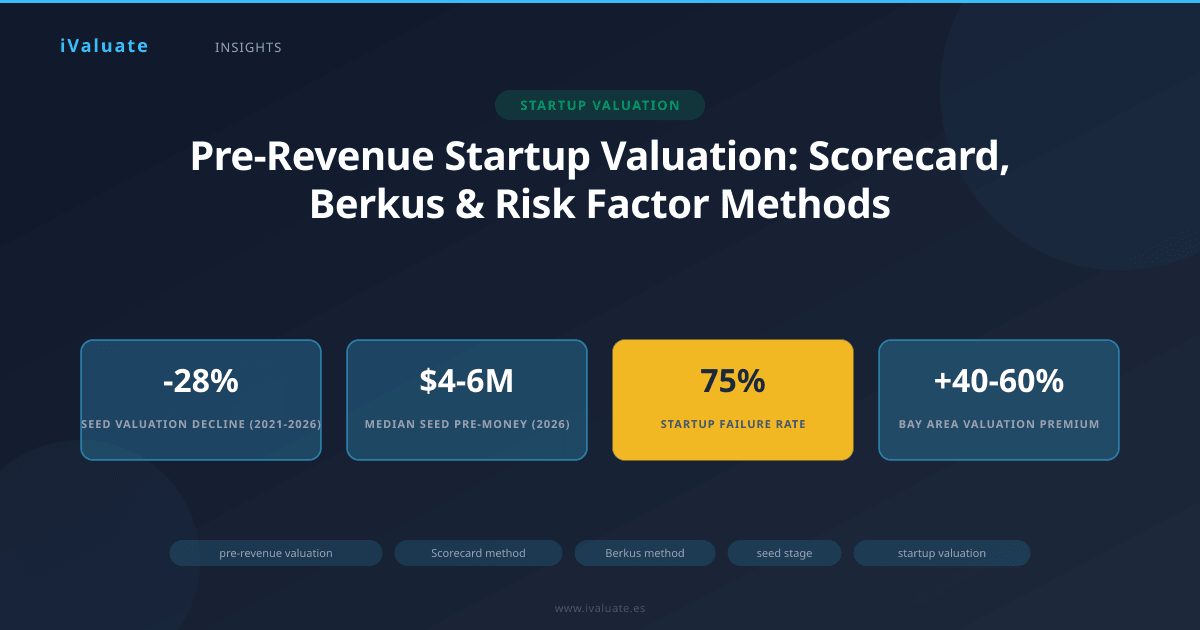
The valuation challenge intensifies when considering that approximately 75% of venture-backed startups fail to return investors' capital, yet the top decile can generate returns exceeding 50x. This extreme bimodal distribution means that traditional risk-adjusted return models break down—the mathematics of startup investing operate on power law dynamics rather than normal distributions.
In response, practitioners have developed qualitative and semi-quantitative frameworks that assess value drivers specific to early-stage companies: team quality, market opportunity, product development stage, competitive positioning, and execution risk. These methods don't eliminate subjectivity—they structure it.
02 The Scorecard Valuation Method
Developed by Bill Payne and refined through thousands of angel investment decisions, the Scorecard Method (also called the Bill Payne Method) has become the most widely adopted pre-revenue valuation framework in North American angel networks. The methodology works by comparing the target startup against typical companies in the same sector and region, then adjusting for specific strengths and weaknesses.
Core Methodology
The Scorecard Method begins with establishing a baseline valuation—the average pre-money valuation for seed-stage companies in the target's industry and geography. In 2025-2026, these baseline figures vary considerably:
- Enterprise SaaS (North America): $4.5M - $6.5M
- Consumer mobile applications: $2.5M - $4.0M
- Biotech/life sciences: $5.0M - $8.0M
- Fintech: $4.0M - $6.0M
- Climate tech/clean energy: $3.5M - $5.5M
The evaluator then assesses the target company across seven weighted factors, assigning a percentage adjustment (typically 0% to 130%) for each:
- Strength of Management Team (0-30%): Experience, domain expertise, previous exits, complementary skill sets, ability to attract talent
- Size of Opportunity (0-25%): Total addressable market, market growth rate, timing, scalability potential
- Product/Technology (0-15%): Competitive differentiation, intellectual property, technical feasibility, development stage
- Competitive Environment (0-10%): Barriers to entry, competitive intensity, sustainable advantages
- Marketing/Sales Channels (0-10%): Go-to-market strategy, customer acquisition approach, partnership potential
- Need for Additional Investment (0-5%): Capital efficiency, runway to key milestones, follow-on funding requirements
- Other Factors (0-5%): Regulatory environment, macroeconomic conditions, strategic value
Each factor receives a comparison rating: below average (0.5x - 0.75x), average (1.0x), or above average (1.25x - 1.5x). The weighted average of these factors produces a composite multiplier applied to the baseline valuation.
Practical Application Example
Consider a seed-stage enterprise SaaS company developing AI-powered supply chain optimization software. Using a baseline valuation of $5.0M for enterprise SaaS in their region:
- Management Team (30% weight): 1.3x (experienced founders with previous exit)
- Market Opportunity (25% weight): 1.2x (large TAM, strong growth, good timing)
- Product/Technology (15% weight): 1.1x (solid differentiation, early prototype)
- Competitive Environment (10% weight): 0.9x (several established competitors)
- Marketing/Sales (10% weight): 1.0x (standard enterprise sales approach)
- Additional Investment (5% weight): 1.1x (capital efficient, clear milestones)
- Other Factors (5% weight): 1.0x (neutral regulatory environment)
Composite multiplier: (0.30 × 1.3) + (0.25 × 1.2) + (0.15 × 1.1) + (0.10 × 0.9) + (0.10 × 1.0) + (0.05 × 1.1) + (0.05 × 1.0) = 1.165
Adjusted valuation: $5.0M × 1.165 = $5.825M pre-money valuation
For a $1.5M seed round, this implies a post-money valuation of $7.325M and investor ownership of approximately 20.5%.
Strengths and Limitations
The Scorecard Method's primary strength lies in its structured approach to comparative analysis. By anchoring to market norms and systematically evaluating key value drivers, it reduces—though doesn't eliminate—individual bias. The weighted factor approach also allows investors to emphasize elements they consider most predictive of success.
However, the method's reliance on baseline valuations means it inherently reflects market sentiment and momentum. During the 2020-2021 venture boom, inflated baseline figures produced systematically high valuations that proved unsustainable. Conversely, in the 2022-2024 correction, overly conservative baselines may have undervalued exceptional opportunities. The method also requires significant judgment in factor scoring, and different evaluators can reach materially different conclusions on the same company.
03 The Berkus Method
Created by veteran angel investor and venture capitalist Dave Berkus, this method takes a fundamentally different approach by assigning discrete dollar values to the achievement of specific de-risking milestones. Rather than comparing to market averages, the Berkus Method builds valuation from the ground up based on risk reduction.
The Five Value Pillars
The Berkus Method evaluates five critical risk categories, assigning up to $500,000 in value for each (these figures are periodically adjusted for market conditions; some practitioners now use $600,000-$750,000 in high-cost regions):
- Sound Idea (Basic Value): The business concept addresses a real market need with a viable solution approach. Maximum value: $500K
- Prototype (Reduces Technology Risk): A working prototype or MVP demonstrates technical feasibility and core functionality. Maximum value: $500K
- Quality Management Team (Reduces Execution Risk): Experienced, capable founders with relevant domain expertise and complementary skills. Maximum value: $500K
- Strategic Relationships (Reduces Market Risk): Partnerships, pilot customers, distribution agreements, or advisory board members that validate market acceptance. Maximum value: $500K
- Product Rollout or Sales (Reduces Production Risk): Early customer traction, even if pre-revenue, demonstrating product-market fit. Maximum value: $500K
The maximum pre-money valuation under the traditional Berkus Method is therefore $2.5M, though this cap is often adjusted upward in practice. Many investors now apply multipliers of 1.5x to 2.0x in hot sectors or competitive deals, yielding maximum valuations of $3.75M to $5.0M.
Practical Application Example
Consider a medical device startup developing a novel diagnostic tool for early cancer detection. Applying the Berkus Method in early 2026:
- Sound Idea: $500K (addresses critical unmet need in oncology diagnostics with novel biomarker approach)
- Prototype: $400K (functional prototype tested in laboratory setting, but not yet in clinical trials)
- Management Team: $450K (CEO with previous medtech exit, CTO with relevant PhD, but lacking experienced CFO/COO)
- Strategic Relationships: $300K (letters of intent from two hospital systems, advisory board with respected oncologists)
- Product Rollout: $0 (no patient testing yet, awaiting regulatory pathway clarity)
Total pre-money valuation: $1.65M
This valuation reflects significant de-risking through prototype development and team assembly, but acknowledges remaining regulatory and clinical validation risks. For a $750K seed round, this implies 31% dilution and a post-money valuation of $2.4M.
Strengths and Limitations
The Berkus Method's greatest advantage is its simplicity and focus on tangible risk reduction. Unlike methods requiring extensive market research or comparable analysis, it can be applied quickly with minimal data. The discrete value increments also create clear incentives for founders—each milestone achieved demonstrably increases company value.
The primary limitation is the arbitrary nature of the dollar amounts assigned to each pillar. Why is a prototype worth exactly $500K? The method provides no theoretical justification for these figures, which were essentially calibrated to match early 2000s angel investment norms. Additionally, the method's low valuation ceiling (even when adjusted) often proves inadequate for capital-intensive ventures or companies in highly competitive sectors where talent acquisition requires meaningful equity grants.
The Berkus Method works best for capital-efficient software and technology companies in their earliest stages. It's less suitable for biotech, hardware, or other ventures requiring substantial capital before achieving meaningful milestones.
04 Risk Factor Summation Method
The Risk Factor Summation (RFS) approach, popularized by the Ohio TechAngels, provides a more granular risk assessment framework than either Scorecard or Berkus. It begins with a baseline valuation, then systematically adjusts for twelve specific risk factors.
The Twelve Risk Factors
Each risk factor is evaluated on a five-point scale: +2 (very positive), +1 (positive), 0 (neutral), -1 (negative), or -2 (very negative). Each point typically represents a $250K adjustment to the baseline valuation, though this increment varies by market conditions and deal size.
The twelve factors assessed are:
- Management Risk: Team experience, track record, completeness, commitment
- Stage of Business: Development progress, time to market, operational maturity
- Legislation/Political Risk: Regulatory environment, compliance requirements, policy changes
- Manufacturing Risk: Production complexity, supply chain dependencies, scalability
- Sales and Marketing Risk: Go-to-market strategy, customer acquisition cost, sales cycle
- Funding/Capital Raising Risk: Ability to secure follow-on funding, capital efficiency, burn rate
- Competition Risk: Competitive intensity, barriers to entry, market positioning
- Technology Risk: Technical feasibility, IP strength, development complexity
- Litigation Risk: Existing or potential legal issues, IP disputes, regulatory investigations
- International Risk: Geographic expansion challenges, currency exposure, cultural barriers
- Reputation Risk: Brand perception, founder background, previous venture outcomes
- Potential Lucrative Exit: Acquisition likelihood, IPO potential, strategic value to acquirers
Practical Application Example
Consider a fintech startup developing embedded banking infrastructure for vertical SaaS platforms. Starting with a $4.5M baseline for fintech seed rounds:
- Management Risk: +1 (strong technical team, but first-time founders)
- Stage of Business: 0 (functional product, early pilots, no revenue)
- Legislation/Political: -1 (complex regulatory environment, compliance overhead)
- Manufacturing Risk: +1 (software-only, no physical production)
- Sales and Marketing: 0 (standard B2B SaaS approach, unproven at scale)
- Funding/Capital Risk: +1 (strong investor interest, capital efficient model)
- Competition: -1 (several well-funded competitors, including incumbents)
- Technology: +1 (proprietary approach to compliance automation)
- Litigation: 0 (no current issues, standard IP position)
- International: 0 (US-focused initially, international expansion later)
- Reputation: 0 (neutral, no significant positive or negative factors)
- Lucrative Exit: +1 (clear acquisition interest from vertical SaaS platforms)
Total risk adjustment: +3 points × $250K = +$750K
Adjusted pre-money valuation: $4.5M + $750K = $5.25M
This valuation reflects the company's technical strengths and exit potential while acknowledging regulatory complexity and competitive pressures. For a $2.0M seed round, this implies 27.6% dilution and a $7.25M post-money valuation.
Strengths and Limitations
The Risk Factor Summation method's comprehensive risk assessment provides more nuanced analysis than simpler frameworks. By evaluating twelve distinct dimensions, it captures complexity that binary or five-factor models might miss. The granular scoring also facilitates productive discussions between founders and investors about specific concerns and mitigation strategies.
However, this comprehensiveness comes at a cost. The method requires significantly more time and analysis than Scorecard or Berkus approaches. The twelve-factor framework can also create false precision—assigning exact dollar values to subjective risk assessments doesn't eliminate their fundamental subjectivity. Additionally, the equal weighting of all factors (each point = $250K) may not reflect their relative importance in specific contexts. Management risk, for instance, likely matters more than international risk for a purely domestic startup.
05 Comparative Analysis and Method Selection
Each method serves different purposes and contexts. The Scorecard Method works best when robust comparable data exists and the startup fits clearly within an established category. It's the preferred approach for angel networks and seed funds making multiple investments in similar sectors, as it enables portfolio-level consistency.
The Berkus Method excels in very early-stage situations—pre-seed and seed rounds for companies still proving basic feasibility. Its simplicity makes it ideal for individual angel investors or first-time founders seeking to understand valuation drivers. However, its low valuation ceiling limits applicability to larger seed rounds or competitive situations.
Risk Factor Summation provides the most comprehensive analysis, making it valuable for complex situations involving novel business models, uncertain regulatory environments, or significant technical risk. It's particularly useful when investors and founders disagree on valuation—the structured framework helps identify specific points of divergence.
Key Insight: In practice, sophisticated investors rarely rely on a single method. Instead, they triangulate across multiple approaches, using the range of outputs to inform negotiation and structure. A company valued at $4.0M by Berkus, $5.5M by Scorecard, and $5.0M by RFS might reasonably settle at $4.5M-$5.0M pre-money.
06 Market Context: 2025-2026 Seed Stage Environment
Understanding these methods requires situating them in current market conditions. The seed-stage environment of 2025-2026 differs markedly from the exuberant 2020-2021 period. Several trends shape contemporary pre-revenue valuations:
Valuation Compression: Median seed-stage pre-money valuations have declined approximately 28% from 2021 peaks, settling in the $4M-$6M range for most sectors. This correction reflects both broader market conditions and increased investor discipline following the 2022-2024 venture downturn.
Milestone Emphasis: Investors increasingly demand concrete evidence of progress before committing capital. The bar for "fundable" has risen—what constituted a seed-stage company in 2021 might now be considered pre-seed. This shift makes milestone-based methods like Berkus particularly relevant.
Regional Divergence: Geographic disparities in seed valuations have widened. San Francisco Bay Area seed rounds continue to command 40-60% premiums over other US markets, while European seed valuations typically run 20-35% below US comparables. These regional factors must inform baseline selections in comparative methods.
Sector Polarization: AI-related startups command significant premiums (often 50-100% above sector baselines), while consumer social and e-commerce ventures face skepticism and compressed valuations. This polarization requires careful sector selection when establishing Scorecard baselines.
07 Advanced Considerations and Hybrid Approaches
Experienced practitioners often develop hybrid methodologies combining elements from multiple frameworks. A common approach uses Scorecard to establish a baseline range, Berkus to validate milestone achievement, and RFS to identify specific risk factors requiring mitigation or term sheet protection.
For example, a deep-tech hardware startup might warrant a hybrid approach:
- Use Berkus to value technical de-risking (prototype development, patent filings)
- Apply RFS to assess manufacturing and supply chain risks specific to hardware
- Reference Scorecard for market opportunity and team quality comparisons
- Synthesize into a final range, with specific risks addressed through staged funding, milestones, or protective provisions
This triangulated approach produces more robust valuations than any single method while highlighting areas requiring special attention in deal structuring.
08 Common Pitfalls and Best Practices
Several common errors undermine pre-revenue valuations:
Anchoring Bias: Over-relying on the first number mentioned (often the founder's target) distorts subsequent analysis. Effective practitioners establish independent valuations before reviewing founder expectations.
Recency Bias: Giving disproportionate weight to recent funding announcements, particularly outlier deals, skews baseline selections. Median valuations provide better anchors than highly publicized exceptions.
Confirmation Bias: Selectively emphasizing factors that support a predetermined conclusion undermines the analytical process. Structured methods help counter this tendency by forcing systematic evaluation.
False Precision: Reporting valuations to excessive decimal places ($5,247,382) implies accuracy these methods cannot deliver. Ranges ($4.5M-$5.5M) better reflect inherent uncertainty.
Best practices include:
- Document assumptions and factor scores to enable sensitivity analysis
- Validate baseline figures against recent, comparable transactions
- Involve multiple evaluators to reduce individual bias
- Update valuations as new information emerges (monthly or quarterly for active deals)
- Use valuation ranges rather than point estimates in negotiations
- Consider cap table implications and founder dilution tolerance
09 Integration with Term Sheet Negotiations
Pre-revenue valuations don't exist in isolation—they directly inform term sheet economics and structure. A $5M pre-money valuation for a $1.5M seed round implies 23% investor ownership, but the actual dilution depends on option pool sizing, warrant coverage, and conversion mechanics.
Sophisticated investors often trade valuation against other terms. A higher valuation might come with:
- Participating preferred stock (investors get preference plus pro-rata common returns)
- Multiple liquidation preferences (2x or higher return priority)
- Full ratchet anti-dilution protection (maximum dilution protection for investors)
- Aggressive milestone requirements triggering valuation adjustments
Conversely, founder-friendly terms (standard 1x non-participating preferred, broad-based weighted average anti-dilution) might justify lower valuations. Effective negotiators optimize across the entire term sheet, not just the headline valuation number.
10 The Role of Technology in Modern Valuation Practice
The mechanical application of these frameworks—gathering comparables, scoring factors, calculating adjustments—increasingly benefits from technological support. Modern valuation platforms enable practitioners to:
- Access real-time comparable transaction data across sectors and geographies
- Apply multiple methodologies simultaneously and compare outputs
- Model sensitivity to key assumptions and factor scores
- Generate professional valuation reports for investment committees
- Track portfolio company valuations over time as milestones are achieved
While technology cannot replace professional judgment in assessing team quality or market opportunity, it dramatically improves efficiency and consistency in applying these frameworks at scale.
11 Looking Forward: Evolution of Pre-Revenue Valuation
Pre-revenue valuation methodologies continue to evolve in response to market dynamics and emerging business models. Several trends will likely shape practice in coming years:
AI-Enhanced Assessment: Machine learning models trained on thousands of seed investments are beginning to identify patterns in successful early-stage companies, potentially augmenting human judgment in factor scoring and baseline selection.
Outcome-Based Validation: As more seed-stage cohorts mature, empirical analysis of which early indicators actually predicted success will refine factor weights and scoring approaches. Preliminary research suggests team quality and market timing matter more than initially believed, while technology risk matters less.
Globalization of Standards: As venture capital becomes increasingly global, pressure grows for standardized valuation approaches that work across jurisdictions. Expect continued convergence around core methodologies like Scorecard and RFS.
Regulatory Scrutiny: Increased attention to startup valuations from tax authorities, securities regulators, and accounting standard-setters may drive demand for more rigorous, defensible methodologies with clear documentation trails.
Despite these evolutions, the fundamental challenge remains unchanged: assigning monetary value to highly uncertain future outcomes based on limited present information. The methods examined here—Scorecard, Berkus, and Risk Factor Summation—provide structured frameworks for this inherently subjective exercise, but they cannot eliminate uncertainty or guarantee accuracy.
12 Conclusion
Pre-revenue startup valuation represents one of corporate finance's most challenging domains, requiring practitioners to assess potential rather than performance, vision rather than results. The Scorecard Method, Berkus Method, and Risk Factor Summation approach this challenge from different angles—comparative analysis, milestone achievement, and comprehensive risk assessment—but all share a common goal: structuring subjective judgment to produce defensible, negotiable valuations.
In the current market environment of 2025-2026, characterized by increased investor discipline, compressed valuations, and heightened emphasis on concrete milestones, mastery of these frameworks has become essential for both investors and founders. The most sophisticated practitioners don't rely on any single method but instead triangulate across multiple approaches, using the range of outputs to inform negotiation while remaining grounded in market reality.
Success in pre-revenue valuation ultimately depends on combining analytical rigor with market awareness, theoretical frameworks with practical judgment, and quantitative methods with qualitative insight. Tools like iValuate help professionals apply these methodologies efficiently and consistently, but the fundamental skill—assessing early-stage potential with limited data—remains irreducibly human.
As the venture ecosystem continues to mature and data on early-stage outcomes accumulates, these valuation methods will undoubtedly evolve. Yet the core principles—systematic risk assessment, comparative analysis, milestone-based value creation—will likely endure as foundational elements of startup valuation practice for years to come.