Índice8 secciones
The M&A landscape in 2025 has been characterized by a resurgence of mega-deals—transactions exceeding $10 billion in enterprise value—driven by strategic repositioning, technological transformation, and the hunt for scale in an increasingly competitive global economy. After a subdued 2023 and early 2024, dealmakers returned with conviction, deploying record levels of dry powder and leveraging improved financing conditions to execute transformative combinations.
This article examines the most significant transactions of 2025, dissecting their valuation frameworks, the premiums paid, the articulated synergy cases, and what these mega-deals reveal about current market dynamics and valuation methodologies. For M&A advisors, corporate development teams, and valuation professionals, understanding these transactions provides critical benchmarks for comparable transaction analysis and insights into how strategic buyers and financial sponsors are thinking about value creation in the current environment.
01 The Mega-Deal Resurgence: Market Context
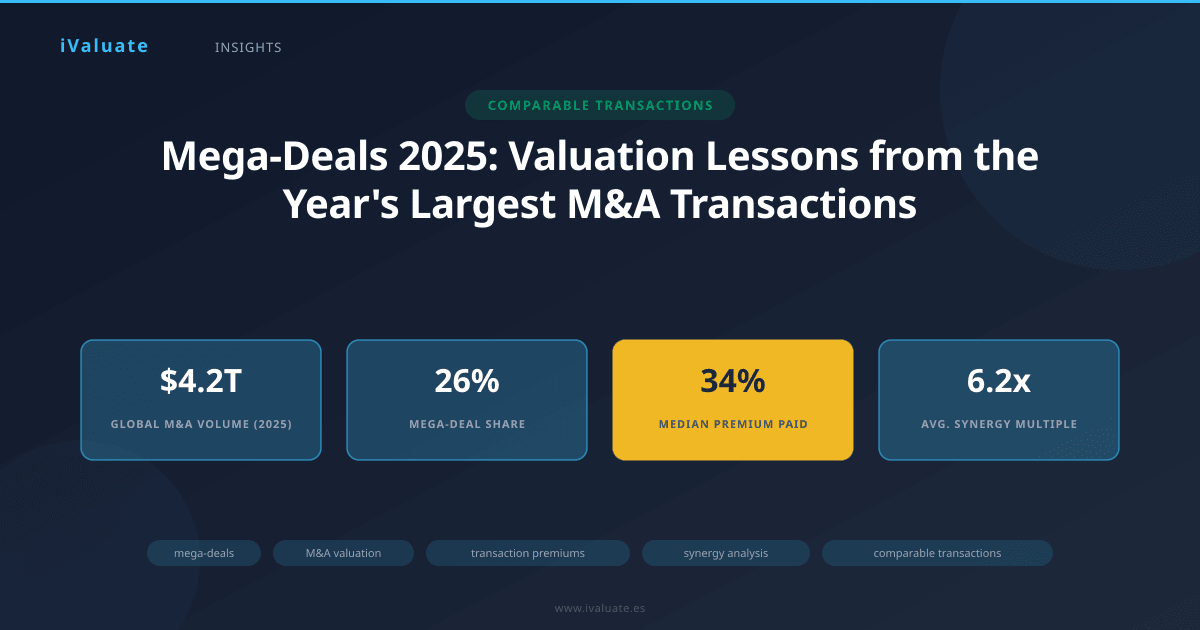
Global M&A activity in 2025 reached approximately $4.2 trillion through Q3, representing a 24% increase over the comparable period in 2024. Mega-deals—those exceeding $10 billion—accounted for roughly $1.1 trillion of this total, or 26% of overall deal value, the highest concentration since 2021. This resurgence reflects several converging factors:
- Financing market normalization: Investment-grade credit spreads compressed to 95 basis points over Treasuries by mid-2025, down from 135 basis points in early 2024, making large-scale debt financing more accessible and economically attractive
- Strategic imperative for scale: Intensifying competition in technology, healthcare, and energy transition sectors drove consolidation as companies sought to achieve critical mass in R&D, manufacturing, and distribution
- Private equity deployment pressure: An estimated $2.8 trillion in dry powder across global PE funds created urgency to deploy capital, particularly for large-cap funds seeking platform investments
- Regulatory pragmatism: While antitrust scrutiny remained elevated, regulators demonstrated willingness to approve deals with meaningful remedies, providing greater certainty to transaction planning
02 Transaction Spotlight: The $47 Billion Tech Infrastructure Consolidation
The largest transaction of 2025 was the acquisition of CloudScale Networks by Quantum Computing Systems for $47 billion in enterprise value, announced in March and closed in September. This mega-deal exemplifies several critical valuation dynamics prevalent in the current market.
Deal Rationale and Strategic Logic
Quantum Computing Systems, a leader in next-generation computing architecture, identified CloudScale's global data center footprint and edge computing capabilities as essential infrastructure for deploying quantum-classical hybrid computing solutions at scale. The deal rationale centered on three pillars:
- Vertical integration of computing hardware and infrastructure to capture margin across the value chain
- Acceleration of go-to-market timeline by 3-4 years through immediate access to enterprise customers
- Creation of a differentiated platform combining quantum processing with distributed edge computing
Premium Paid and Valuation Multiples
The $47 billion purchase price represented a 38% premium to CloudScale's unaffected share price (measured 30 days prior to deal rumors). From a multiples perspective, the transaction valued CloudScale at:
- EV/Revenue: 6.2x based on forward twelve-month revenue estimates of $7.6 billion
- EV/EBITDA: 22.4x based on adjusted EBITDA of $2.1 billion
- EV/EBITDA (post-synergies): 15.8x incorporating management's $850 million annual run-rate synergy estimate
These multiples positioned the transaction at the upper end of recent tech infrastructure deals but below the peak valuations observed in 2021. The premium paid reflected both the strategic scarcity value of CloudScale's assets and the competitive tension created by two other potential acquirers in the process.
Synergy Value and Creation Thesis
Management articulated a detailed synergy case totaling $850 million in annual run-rate savings and revenue enhancements, expected to be fully realized within 36 months post-close:
- Cost synergies ($520 million): Elimination of duplicate corporate functions ($180 million), procurement optimization through combined scale ($210 million), and data center operational efficiency ($130 million)
- Revenue synergies ($330 million): Cross-selling quantum computing services to CloudScale's enterprise base ($220 million) and accelerated adoption of hybrid solutions ($110 million)
At a 10x multiple on the synergy value, these benefits contributed approximately $8.5 billion to transaction value, representing 18% of the total consideration. This synergy-to-premium ratio of 1.8x provided meaningful headroom for value creation even if realization fell short of targets.
The CloudScale-Quantum deal illustrates a critical valuation principle: in mega-deals, the premium paid must be justified not just by standalone value but by a credible, quantified synergy thesis that creates value beyond what either party could achieve independently.
03 Healthcare Consolidation: The $34 Billion Biopharma Combination
The second-largest transaction of 2025 was the merger of equals between Helix Therapeutics and Genomic Pharma, creating a combined entity with $34 billion in enterprise value. This all-stock transaction reflected different valuation dynamics than strategic acquisitions.
Deal Structure and Exchange Ratio
The merger was structured as a stock-for-stock exchange with Helix shareholders receiving 1.15 shares of the combined company for each Helix share, implying a 52/48 ownership split. The exchange ratio was determined through extensive relative valuation analysis considering:
- Relative contribution analysis based on revenue, EBITDA, and pipeline value
- Comparable company trading multiples for each entity
- Discounted cash flow analyses incorporating probability-weighted pipeline assets
- Precedent merger-of-equals transactions in biopharma
At announcement, Helix traded at 4.8x forward revenue and 18.2x forward EBITDA, while Genomic Pharma traded at 5.2x revenue and 21.4x EBITDA. The exchange ratio implied a modest 6% premium to Helix shareholders based on pre-announcement trading levels, reflecting the mutual strategic benefits and the merger-of-equals positioning.
Synergy Value in Pharmaceutical Combinations
The combined company projected $1.2 billion in annual cost synergies, primarily from:
- R&D rationalization and elimination of duplicative programs ($480 million)
- Commercial infrastructure optimization across overlapping geographies ($390 million)
- Manufacturing and supply chain consolidation ($210 million)
- Corporate overhead reduction ($120 million)
Notably, management took a conservative approach to revenue synergies, citing only $180 million from enhanced commercial capabilities rather than making aggressive cross-selling assumptions. This conservatism reflected lessons learned from previous biopharma mega-deals where revenue synergy realization significantly lagged initial projections.
The total synergy value of $1.38 billion represented approximately 4% of combined enterprise value, a relatively modest figure that provided credibility to the business case while limiting integration risk.
04 Energy Transition: The $28 Billion Renewables Platform
The acquisition of SolarWind Energy by Global Power Partners for $28 billion represented the largest renewable energy transaction in history and highlighted the premium valuations commanded by clean energy platforms with scale and geographic diversification.
Premium Paid in High-Growth Sectors
Global Power Partners paid a 44% premium to SolarWind's unaffected share price, the highest premium among major 2025 transactions. This elevated premium reflected several factors:
- Scarcity value of integrated solar and wind platforms with operational scale exceeding 15 GW
- Regulatory tailwinds from enhanced tax credits and renewable energy mandates
- Limited universe of comparable assets available for acquisition
- Competitive process with three credible bidders, including a consortium of infrastructure funds
From a multiples perspective, the transaction valued SolarWind at 18.5x forward EBITDA and 3.2x rate base, representing a 25-30% premium to recent renewable energy transactions. The valuation incorporated assumptions about contracted revenue visibility (78% of projected revenue under long-term PPAs), development pipeline value, and the strategic option value of SolarWind's energy storage capabilities.
Deal Rationale: Building the Integrated Energy Company
Global Power Partners articulated a transformation thesis: combining its traditional power generation assets with SolarWind's renewable platform to create a balanced, transition-ready energy company. The deal rationale emphasized:
- Portfolio rebalancing toward 65% renewable generation by 2030
- Enhanced access to low-cost capital through improved ESG profile
- Operational synergies from integrated dispatch and grid management
- Regulatory advantages in markets requiring renewable energy capacity
The synergy case totaled $420 million annually, modest relative to deal size but reflecting the operational nature of the combination rather than traditional cost-cutting. Approximately 60% of synergies derived from optimized capital deployment and financing costs rather than operational efficiencies.
05 Financial Sponsor Mega-Deals: The $22 Billion Take-Private
The take-private of Industrial Automation Group by Apex Partners for $22 billion represented the largest leveraged buyout since 2022 and demonstrated renewed financial sponsor appetite for mega-deals in an improving financing environment.
Valuation and Financing Structure
Apex Partners paid a 32% premium to the 60-day volume-weighted average price, valuing Industrial Automation at 11.8x LTM EBITDA. The financing structure included:
- $8.2 billion in equity (37% of total capitalization)
- $10.5 billion in senior secured debt (4.8x leverage)
- $3.3 billion in subordinated notes and preferred equity
The transaction was financed at a blended cost of debt of 7.2%, down from 9%+ for comparable transactions in 2023, reflecting improved credit market conditions. At the entry multiple and leverage level, Apex Partners required approximately 15% revenue growth and 200 basis points of EBITDA margin expansion over a five-year hold period to achieve a 20% IRR at a 10x exit multiple.
Value Creation Plan
Unlike strategic acquirers focused on synergies, Apex Partners' value creation thesis centered on operational improvements and strategic repositioning:
- Accelerated digital transformation of manufacturing operations ($180 million EBITDA impact)
- Portfolio optimization through divestiture of non-core divisions ($2.1 billion in proceeds)
- Pricing optimization and commercial excellence initiatives ($220 million EBITDA impact)
- Selective M&A to consolidate fragmented end markets ($150 million EBITDA impact)
The total EBITDA improvement target of $550 million over four years represented a 24% increase from the entry baseline, ambitious but within the range of successful PE operational value creation programs.
06 Cross-Border Complexity: The $19 Billion European-Asian Combination
The acquisition of AsiaManufacturing Corp by EuroTech Industries for $19 billion illustrated the additional valuation complexities inherent in cross-border mega-deals, including currency considerations, regulatory approvals across multiple jurisdictions, and cultural integration challenges.
Premium and Valuation Adjustments
EuroTech paid a 29% premium to AsiaManufacturing's unaffected share price, but the effective premium varied significantly based on currency movements during the six-month period between signing and closing. The transaction was denominated in U.S. dollars but included a collar mechanism to protect both parties from extreme currency fluctuations:
- If EUR/USD moved beyond a ±8% band, the exchange ratio would adjust
- Beyond ±12%, either party had termination rights
- The collar mechanism effectively capped currency risk at approximately $760 million
The valuation incorporated country risk premiums, with AsiaManufacturing's cash flows discounted at 11.2% (including a 3.5% country risk premium) compared to 7.8% for comparable European assets. This differential reduced the implied valuation by approximately 18% relative to a purely domestic transaction.
Synergy Realization Challenges
Management projected $680 million in annual synergies but acknowledged a longer realization timeline (48 months vs. 36 months for domestic deals) due to:
- Regulatory requirements to maintain separate operations in certain jurisdictions
- Complexity of integrating disparate ERP and IT systems
- Cultural and organizational integration across 23 countries
- Phased approach to procurement optimization given supply chain dependencies
Valuation professionals applying this transaction as a comparable must adjust for these cross-border complexities, typically applying a 15-25% discount to stated synergy values when benchmarking against domestic transactions.
07 Valuation Implications and Lessons for Practitioners
Analysis of 2025's mega-deals reveals several critical insights for valuation professionals and M&A advisors:
Premium Dispersion and Deal Rationale
Premiums paid in 2025 mega-deals ranged from 6% (merger of equals) to 44% (strategic scarcity), with a median of 34%. This dispersion reflects the importance of deal-specific factors:
- Strategic scarcity: Unique assets with limited alternatives command 38-45% premiums
- Competitive processes: Multiple credible bidders add 8-12 percentage points to premiums
- Synergy magnitude: Each dollar of credible synergy value supports approximately $0.55 of premium
- Market conditions: Sector-specific momentum (e.g., renewable energy, AI infrastructure) adds 5-10 percentage points
Synergy Value Quantification
Across the major 2025 transactions, synergy values averaged 6.2x the annual run-rate benefit, ranging from 4.5x for operational synergies to 8.5x for revenue synergies. Critical factors affecting synergy multiples include:
- Realization timeline and execution risk
- Proportion of cost vs. revenue synergies (cost synergies command higher multiples)
- Track record of acquirer in integration execution
- Regulatory or contractual constraints on synergy capture
Valuation professionals should apply haircuts of 20-40% to management synergy projections when performing independent valuations, with larger discounts for revenue synergies and cross-border integrations.
Multiple Expansion and Compression
Strategic mega-deals in 2025 were completed at a median EV/EBITDA multiple of 14.2x, compared to 11.8x for financial sponsor transactions. This 2.4-turn differential reflects:
- Strategic buyers' ability to realize synergies unavailable to financial sponsors
- Longer hold periods and different return requirements
- Access to lower-cost capital (particularly for investment-grade acquirers)
- Willingness to pay for strategic optionality and defensive positioning
When using comparable transactions for valuation purposes, practitioners must carefully segment strategic vs. financial buyer transactions and adjust multiples accordingly.
The most sophisticated acquirers in 2025 moved beyond simple multiple-based valuation to comprehensive value creation frameworks that quantified synergies, integration costs, financing impacts, and strategic optionality—a best practice that all M&A professionals should adopt.
08 Looking Ahead: Implications for 2026 and Beyond
The mega-deals of 2025 provide important signals about the evolving M&A landscape and valuation methodologies. Several trends are likely to shape transaction activity and valuation approaches in 2026:
Increased scrutiny of synergy realization: With several high-profile transactions from 2022-2023 falling short of synergy targets, boards and investors are demanding more rigorous synergy validation, including third-party verification and performance-based consideration structures.
AI and technology integration premiums: Transactions that credibly demonstrate AI-enabled synergies or technological transformation are commanding 15-25% valuation premiums relative to traditional operational combinations. Expect this trend to accelerate as AI capabilities become table stakes across industries.
ESG and sustainability value: Renewable energy and sustainability-focused transactions continue to trade at premium multiples, with investors willing to accept lower near-term returns for exposure to long-term secular growth trends and regulatory tailwinds.
Financing structure innovation: The return of mega-deals has been accompanied by creative financing structures, including earn-outs tied to synergy realization, equity rollovers to align management incentives, and hybrid securities to optimize capital structure and minimize dilution.
For M&A advisors and corporate development teams, the key lesson from 2025's mega-deals is the critical importance of rigorous, defensible valuation analysis that goes beyond simple multiples to incorporate deal-specific synergies, integration risks, and strategic value. Transactions are increasingly won or lost based on the quality of valuation work and the credibility of value creation plans.
Professional valuation platforms like iValuate have become essential tools for M&A professionals seeking to perform sophisticated comparable transaction analysis, incorporating deal-specific adjustments for premiums, synergies, and structural considerations. As mega-deals continue to reshape industry landscapes, the ability to quickly access relevant precedent transactions and perform robust valuation analysis will remain a critical competitive advantage for advisors and corporate practitioners alike. The transactions of 2025 have set new benchmarks—understanding them thoroughly positions professionals to navigate the complex M&A environment ahead.