Índice8 secciones
Goodwill impairment testing remains one of the most technically demanding and judgment-intensive exercises in financial reporting. Under IAS 36 Impairment of Assets, companies must test goodwill for impairment at least annually, regardless of whether there are indicators of impairment. As we navigate the volatile economic environment of 2025-2026, characterized by elevated interest rates, geopolitical uncertainty, and sector-specific disruptions, the rigor applied to these tests has never been more critical.
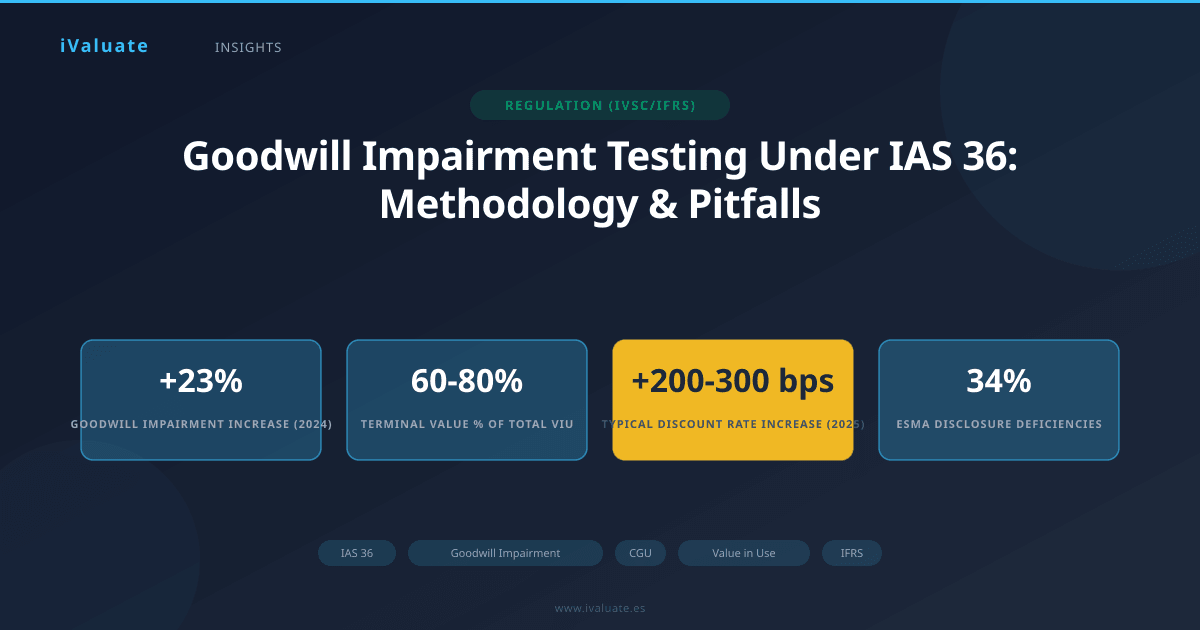
Recent data from the Big Four accounting firms indicates that goodwill impairment charges across European and global markets increased by approximately 23% in 2024 compared to 2023, with technology, retail, and real estate sectors experiencing the most significant write-downs. This trend underscores the importance of robust impairment testing methodologies and the costly consequences of inadequate analysis.
01 The IAS 36 Framework: Core Principles
IAS 36 establishes a comprehensive framework for ensuring that assets are carried at no more than their recoverable amount. The recoverable amount is defined as the higher of an asset's (or cash-generating unit's) fair value less costs of disposal and its value in use. When the carrying amount exceeds the recoverable amount, an impairment loss must be recognized.
For goodwill specifically, the standard requires annual testing and prohibits subsequent reversal of impairment losses—a one-way street that makes the initial assessment critically important. This asymmetry creates significant pressure on management teams and auditors to get the analysis right the first time.
The Cash-Generating Unit Concept
Because goodwill does not generate cash flows independently, IAS 36 requires it to be allocated to cash-generating units (CGUs) or groups of CGUs. A CGU is defined as the smallest identifiable group of assets that generates cash inflows that are largely independent of the cash inflows from other assets or groups of assets.
CGU identification represents the first critical judgment in the impairment testing process. In practice, CGUs often align with operating segments under IFRS 8, but this is not automatic. The determination must reflect how management monitors goodwill and makes decisions about continuing or disposing of assets and operations.
A common pitfall: Companies sometimes define CGUs too broadly to avoid triggering impairments, or too narrowly in ways that don't reflect economic reality. Regulators, particularly ESMA, have increasingly scrutinized CGU definitions in recent years.
02 Calculating Recoverable Amount: The Two-Path Approach
Once CGUs are properly identified, the next step is determining recoverable amount. While IAS 36 allows companies to use either fair value less costs of disposal (FVLCD) or value in use (VIU), whichever is higher, most companies default to value in use calculations for goodwill impairment testing. This preference stems from the fact that VIU can often be calculated using internal projections without requiring extensive market data.
Value in Use: The Discounted Cash Flow Foundation
Value in use represents the present value of future cash flows expected to be derived from a CGU. The calculation requires five critical inputs:
- Cash flow projections: Typically based on management's most recent budgets and forecasts, covering a period of up to five years
- Terminal value: Reflecting cash flows beyond the explicit forecast period, usually calculated using a perpetuity growth model
- Discount rate: A pre-tax rate reflecting current market assessments of the time value of money and risks specific to the CGU
- Growth assumptions: Both for the explicit forecast period and the terminal growth rate
- Working capital and capital expenditure requirements: To convert accounting profits to cash flows
In the current environment of 2025-2026, discount rates have become particularly contentious. With risk-free rates substantially higher than the 2010-2021 period—the 10-year government bond yields in major economies ranging from 3.5% to 4.5%—discount rates for most CGUs have increased by 200-300 basis points compared to historical norms. This mechanical increase in discount rates has compressed value in use calculations, triggering impairments even where operational performance remains stable.
Fair Value Less Costs of Disposal: The Market Alternative
Fair value less costs of disposal represents the amount obtainable from the sale of a CGU in an arm's length transaction between knowledgeable, willing parties, less the costs of disposal. This approach is mandatory when a CGU is held for sale or when reliable market data is available.
FVLCD calculations typically employ one of three approaches:
- Market approach: Using comparable company multiples or precedent transactions
- Income approach: Discounted cash flow analysis from a market participant perspective
- Cost approach: Rarely used for goodwill-bearing CGUs
The key distinction between FVLCD and VIU lies in perspective: FVLCD reflects what a market participant would pay, while VIU reflects the specific value to the current owner. This can lead to significant differences, particularly when a company has synergies or operational advantages that wouldn't transfer to a buyer.
03 Discount Rate Determination: The Technical Cornerstone
The discount rate represents perhaps the most technically complex and impactful assumption in impairment testing. IAS 36 requires a pre-tax discount rate that reflects current market assessments of the time value of money and the risks specific to the asset or CGU.
Building the Weighted Average Cost of Capital
Most practitioners start with a weighted average cost of capital (WACC) framework, then adjust to arrive at a pre-tax rate. The process involves:
Step 1: Determine the risk-free rate. In 2025-2026, practitioners typically use 10-year government bond yields for the relevant currency. For Euro-denominated CGUs, this currently ranges from 3.2% to 3.8% depending on the specific country's sovereign risk.
Step 2: Calculate the equity risk premium. Historical equity risk premiums in developed markets typically range from 5.0% to 7.0%, though current market volatility has pushed some estimates toward the higher end of this range.
Step 3: Determine beta. This requires identifying comparable publicly traded companies and relevering beta to reflect the CGU's specific capital structure. In 2025, median betas for different sectors vary significantly: technology companies average 1.3-1.5, consumer staples 0.7-0.9, and industrials 1.0-1.2.
Step 4: Add company-specific risk premiums. For private companies or CGUs with unique risk profiles, additional premiums of 1.0% to 3.0% may be warranted.
Step 5: Calculate the cost of debt. This should reflect current borrowing rates, not historical rates embedded in existing debt. With central bank rates elevated in 2025-2026, investment-grade corporate borrowing costs typically range from 4.5% to 6.5%.
Step 6: Weight by capital structure. Use market values, not book values, and consider the target capital structure a market participant would employ.
Step 7: Convert to pre-tax. IAS 36 requires pre-tax discount rates, necessitating an iterative calculation that grosses up the after-tax WACC to produce equivalent present values.
Critical insight: The pre-tax discount rate is NOT simply the after-tax rate divided by (1 - tax rate). The correct pre-tax rate must be derived iteratively to ensure that discounting pre-tax cash flows produces the same result as discounting post-tax cash flows at the after-tax rate.
Real-World Example: Technology Sector CGU
Consider a European software company that acquired a cloud infrastructure business in 2022 for €500 million, resulting in €180 million of goodwill. By late 2025, the CGU shows the following characteristics:
- Risk-free rate (10-year German Bund): 3.5%
- Equity risk premium: 6.5%
- Relevered beta: 1.4
- Company-specific risk premium: 1.5% (reflecting customer concentration)
- Cost of debt: 5.2%
- Target debt-to-equity ratio: 20/80
- Tax rate: 25%
The after-tax cost of equity calculates to 13.6% [3.5% + (1.4 × 6.5%) + 1.5%]. The after-tax WACC comes to 11.7% [(13.6% × 80%) + (5.2% × 75% × 20%)]. Through iterative calculation, the equivalent pre-tax discount rate is approximately 15.1%.
This represents a significant increase from the 9.5% pre-tax rate used in the 2022 acquisition model, primarily driven by higher risk-free rates and increased market volatility. This 570-basis-point increase alone could reduce the CGU's value in use by 20-25%, even with unchanged operational projections.
04 Cash Flow Projections: Balancing Optimism and Prudence
Cash flow projections form the numerator in the value in use calculation and require careful calibration between management's legitimate growth expectations and the conservatism demanded by the impairment testing context.
The Five-Year Forecast Period
IAS 36 permits cash flow projections for up to five years, with longer periods allowed only in exceptional circumstances with robust justification. These projections should be based on:
- The most recent budgets and forecasts approved by management
- Reasonable and supportable assumptions about future conditions
- Historical trends, unless there is objective evidence that future patterns will differ
A common pitfall involves the "hockey stick" projection—flat or declining performance in years 1-2, followed by dramatic improvement in years 3-5. While sometimes justified by turnaround plans or market dynamics, such projections face intense scrutiny from auditors and regulators. The burden of proof lies with management to demonstrate why future performance will deviate from historical trends.
Terminal Value: The Tail That Wags the Dog
Terminal value typically represents 60-80% of total value in use, making the terminal growth rate assumption critically important. IAS 36 requires that growth rates not exceed the long-term average growth rate for the products, industries, or countries in which the entity operates, unless a higher rate can be justified.
In 2025-2026, appropriate terminal growth rates for developed market CGUs typically range from 2.0% to 3.0%, reflecting long-term GDP growth and inflation expectations. Emerging market CGUs might justify rates of 3.5% to 5.0%, though country-specific risk must be reflected in the discount rate.
Regulatory focus: ESMA's 2024 enforcement priorities specifically highlighted terminal growth rates exceeding inflation plus GDP growth as a red flag requiring additional disclosure and justification.
Case Study: Retail Sector Impairment
A multinational retailer with significant e-commerce operations acquired a specialty apparel chain in 2021 for £320 million, recording £95 million in goodwill. By 2025, the CGU faces headwinds from changing consumer preferences and increased competition.
The company's initial 2025 impairment test used:
- Revenue growth: 8% (Year 1), 7% (Year 2), 6% (Years 3-5)
- EBITDA margin: 12% (improving from current 10%)
- Terminal growth rate: 3.0%
- Pre-tax discount rate: 14.2%
This produced a value in use of £285 million against a carrying amount of £310 million (including £95 million goodwill), indicating a £25 million impairment.
However, auditor challenge focused on three areas:
First, the revenue growth assumptions exceeded historical performance (5-year average of 4.2%) without sufficient evidence of market share gains or category expansion.
Second, the EBITDA margin improvement assumed operational efficiencies that hadn't been realized in the two years post-acquisition.
Third, the terminal growth rate of 3.0% exceeded the long-term growth rate of the specialty apparel market (estimated at 2.0-2.5%).
After adjustment to more conservative assumptions—5% revenue growth declining to 3%, stable 10.5% EBITDA margins, and 2.5% terminal growth—the revised value in use fell to £245 million, requiring a £65 million impairment charge. This example illustrates how assumption sensitivity can swing impairment conclusions by 160% (£65M vs. £25M).
05 Common Pitfalls and How to Avoid Them
Pitfall 1: Inconsistent Assumptions Across Valuations
Companies often perform multiple valuations throughout the year—for impairment testing, purchase price allocations, share-based compensation, and financial reporting. A frequent error involves using inconsistent assumptions across these exercises without adequate justification.
For example, using a 12% discount rate for impairment testing in October but a 9% rate for a contemporaneous acquisition valuation creates an obvious inconsistency. While different purposes may justify different assumptions (market participant vs. entity-specific perspectives), these differences must be clearly documented and defensible.
Pitfall 2: Ignoring Market Evidence
When comparable companies trade at multiples significantly below a CGU's implied multiple from impairment testing, this creates a rebuttable presumption of impairment. In 2025, with public market valuations compressed across many sectors, this disconnect has become more common.
For instance, if publicly traded software companies in a CGU's peer group trade at 8.5x forward EBITDA, but the impairment test implies a 13x multiple, management must explain this premium. Legitimate reasons might include superior growth prospects, higher margins, or strategic synergies, but generic assertions won't satisfy auditors or regulators.
Pitfall 3: Inadequate Sensitivity Analysis
IAS 36 requires disclosure of key assumptions and sensitivity analysis when reasonably possible changes in assumptions could trigger impairment. Many companies provide only perfunctory sensitivity disclosures, missing an opportunity to demonstrate robust analysis.
Best practice involves quantifying the impact of:
- 100-basis-point changes in discount rates
- 50-basis-point changes in terminal growth rates
- 10% changes in projected EBITDA
- Changes in key operating assumptions (customer retention, pricing power, etc.)
These sensitivities should be disclosed when the headroom (excess of recoverable amount over carrying amount) is less than 20%, providing stakeholders with transparency about impairment risk.
Pitfall 4: Circular Reference in CGU Definition
Some companies define CGUs in ways that conveniently avoid impairment. For example, aggregating a poorly performing business unit with a strong performer to create sufficient headroom, despite the units operating independently and serving different markets.
The test is whether the units generate largely independent cash inflows. If they do, they should be tested separately. Regulators have increasingly challenged aggregation decisions that appear designed to mask underperformance.
Pitfall 5: Neglecting Costs of Disposal in FVLCD
When using fair value less costs of disposal, companies sometimes underestimate disposal costs. These include not just transaction fees (typically 2-4% for mid-market transactions) but also employee termination costs, contract breakage fees, environmental remediation, and other exit costs.
In cross-border transactions, tax leakage can represent 10-15% of gross proceeds, significantly reducing net proceeds available to the selling entity.
06 Regulatory Scrutiny and Enforcement Trends
The European Securities and Markets Authority (ESMA) has made impairment testing a consistent enforcement priority. In its 2024-2025 enforcement report, ESMA highlighted several recurring deficiencies:
- Insufficient disclosure of key assumptions, particularly discount rates and terminal growth rates (identified in 34% of reviewed filings)
- Inadequate sensitivity analysis when headroom is limited (28% of cases)
- Inconsistent assumptions between impairment tests and other valuations (19% of cases)
- Unjustified optimism in cash flow projections relative to historical performance (23% of cases)
National regulators have taken enforcement actions requiring restatements in several high-profile cases. In 2024, a German industrial company restated two years of financials after regulators determined that its CGU definitions were too broad and its terminal growth assumptions unjustified, resulting in an additional €340 million in impairment charges.
07 Technology and Tools: Enhancing Rigor and Efficiency
The complexity of goodwill impairment testing has driven increased adoption of specialized valuation technology. Modern platforms enable practitioners to:
- Build sophisticated DCF models with dynamic sensitivity analysis
- Access real-time market data for discount rate components
- Benchmark assumptions against peer groups and historical trends
- Document methodologies and assumptions for audit trail purposes
- Perform Monte Carlo simulations to assess probability-weighted outcomes
These tools don't replace professional judgment but enhance the rigor and defensibility of analyses. In an environment of heightened regulatory scrutiny, the ability to demonstrate robust, well-documented analysis provides significant protection against challenge.
08 Looking Ahead: Impairment Testing in 2026 and Beyond
Several trends will shape goodwill impairment testing in the coming years:
Persistent rate volatility: Even as central banks navigate monetary policy, discount rates are likely to remain elevated relative to the 2010-2021 period, maintaining pressure on valuations.
Increased regulatory focus: ESMA and national regulators continue to enhance enforcement capabilities and sophistication, particularly around assumption consistency and sensitivity disclosure.
Climate and ESG considerations: Emerging guidance suggests that material climate risks and ESG factors should be reflected in cash flow projections and risk assessments, adding another layer of complexity.
Technology disruption: AI and automation are reshaping business models across sectors, requiring careful consideration of how these forces affect long-term cash flow sustainability.
Geopolitical fragmentation: Supply chain reconfiguration, trade barriers, and regional conflicts create both risks and opportunities that must be reflected in CGU-level projections.
For CFOs, corporate development teams, and M&A advisors, maintaining technical excellence in impairment testing is not merely a compliance exercise—it's a critical component of financial stewardship and stakeholder communication. The difference between a defensible analysis and a deficient one can mean millions in unexpected charges, regulatory scrutiny, and reputational damage.
Professional platforms like iValuate provide the analytical infrastructure to perform these complex assessments with the rigor and documentation that modern standards demand. As impairment testing requirements continue to evolve and regulatory expectations intensify, the combination of deep technical expertise and sophisticated analytical tools becomes not just advantageous but essential for maintaining the integrity of financial reporting in an increasingly complex global economy.