Índice8 secciones
The global business landscape in 2026 is defined by unprecedented geopolitical complexity. The resurgence of protectionist trade policies, escalating tariff regimes, and persistent regional conflicts have fundamentally altered how corporate valuation professionals assess risk and price transactions. For CFOs, M&A advisors, and private equity professionals, understanding the quantitative impact of geopolitical risk on discount rates, transaction multiples, and deal structures has become not merely important—it is essential.
The confluence of renewed US tariff policies under the Trump administration's return to power, deteriorating EU-US trade relations, and ongoing Middle East conflicts affecting energy markets has created a valuation environment where traditional models require substantial recalibration. Cross-border transaction volumes have experienced significant volatility, with certain corridors seeing declines exceeding 35% while others remain surprisingly resilient. This article examines how sophisticated valuation practitioners are adapting their methodologies to capture these risks accurately.
01 The 2026 Geopolitical Landscape: Key Risk Factors
Three primary geopolitical forces are driving valuation adjustments in 2026:
Trump Tariff Policies 2.0
Following the 2024 election, the Trump administration has implemented what analysts are calling "Tariffs 2.0"—a more comprehensive and strategically targeted approach than the 2018-2019 trade war. The current regime includes baseline tariffs of 15-25% on Chinese manufactured goods, with specific sectors facing rates as high as 60%. Additionally, reciprocal tariff frameworks have been established with the EU (averaging 12-18% on industrial goods) and selective tariffs on Mexican and Canadian imports in automotive and agricultural sectors.
These policies have created immediate margin compression for companies with complex global supply chains. A mid-market industrial components manufacturer we analyzed saw EBITDA margins contract from 18.2% to 14.7% within six months of tariff implementation, directly attributable to increased input costs and the inability to fully pass through price increases to customers operating under long-term contracts.
EU-US Trade Tensions
The transatlantic relationship has deteriorated markedly, with the EU implementing retaliatory measures affecting $78 billion in annual US exports. Technology, aerospace, and agricultural sectors face the most significant headwinds. The European Commission's Digital Markets Act enforcement has intensified, while US responses through export controls on advanced semiconductors and AI technologies have created regulatory fragmentation that increases compliance costs and operational complexity.
Middle East Conflict and Energy Sector Volatility
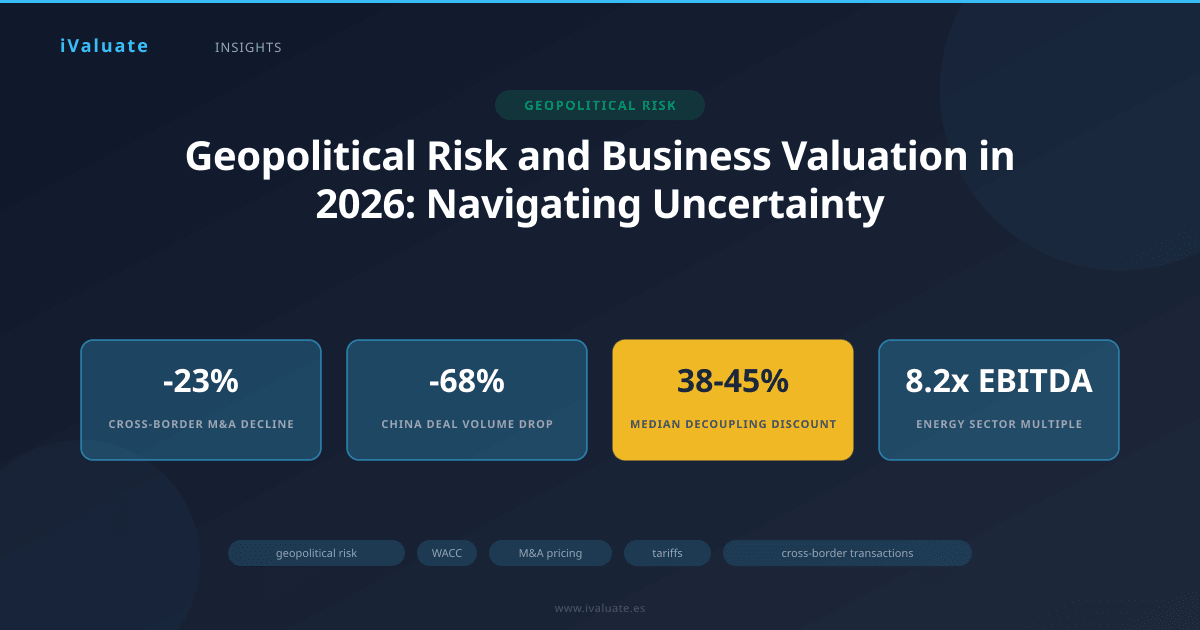
Ongoing regional instability has maintained Brent crude prices in the $88-105 per barrel range throughout 2025-2026, with volatility indices remaining elevated. This has created a bifurcated impact: upstream energy companies command premium valuations (median EV/EBITDA multiples of 8.2x versus 6.4x in 2023), while energy-intensive manufacturing and logistics businesses face margin pressure and valuation discounts.
02 Quantifying Geopolitical Risk in WACC Calculations
The weighted average cost of capital (WACC) serves as the foundation for discounted cash flow valuations, and geopolitical risk manifests primarily through adjustments to the cost of equity. Sophisticated practitioners are employing multiple approaches to capture these risks:
Country Risk Premium Adjustments
The country risk premium (CRP) has become increasingly granular. Rather than applying blanket sovereign risk spreads, advisors are now decomposing CRP into specific components:
- Sovereign default spread: Based on credit default swap (CDS) spreads for government debt
- Trade policy volatility premium: Ranging from 50-200 basis points depending on sector exposure to tariff-affected supply chains
- Regulatory fragmentation premium: An additional 25-150 basis points for businesses operating across multiple regulatory jurisdictions with conflicting requirements
- Currency volatility premium: Particularly relevant for emerging market exposures, adding 75-300 basis points
For a European industrial company with 40% revenue exposure to US markets and 25% to China, we observed CRP adjustments totaling 275 basis points in a recent valuation, compared to 125 basis points applied to a comparable domestic-focused peer. This translated to a WACC of 9.8% versus 7.3%—a difference that reduced enterprise value by approximately 22% when applied to identical cash flow projections.
Sector-Specific Risk Layering
Beyond country-level adjustments, sector-specific geopolitical risk premiums have emerged as standard practice:
Technology and semiconductors: Companies with exposure to US-China technology decoupling face additional risk premiums of 150-250 basis points. A semiconductor equipment manufacturer with significant China revenue (representing 32% of total sales) saw its WACC increase from 8.1% to 10.4% when advisors incorporated both immediate tariff impacts and longer-term market access risks.
Automotive: The sector faces compounding risks from tariffs on components, electric vehicle subsidy nationalism, and supply chain reconfiguration costs. Risk premiums of 100-175 basis points are now standard for traditional OEMs with global footprints.
Energy and utilities: Upstream oil and gas companies benefit from geopolitical risk through higher commodity prices, but face elevated political risk in certain jurisdictions. Renewable energy companies face policy uncertainty premiums of 75-125 basis points as subsidy regimes become increasingly politicized and subject to reversal.
A critical insight from 2026: geopolitical risk is no longer a binary consideration but a spectrum requiring granular, multi-dimensional analysis. The difference between sophisticated and simplistic risk adjustment can represent 15-30% of enterprise value in cross-border transactions.
03 M&A Deal Pricing in the Geopolitical Risk Era
Transaction multiples and deal structures have adapted significantly to reflect geopolitical uncertainty:
Valuation Multiple Compression
Cross-border M&A transactions in 2026 are trading at a median discount of 18% to comparable domestic deals, according to data from transactions completed in Q1-Q3 2026. This represents a widening from the 12% discount observed in 2024. The compression is most pronounced in deals involving:
- Chinese acquirers of US/European targets: 28% discount to domestic comparables
- US acquirers of European industrial assets: 15% discount
- Any transaction involving significant emerging market exposure: 22% discount
A recent transaction illustrates this dynamic: A German precision engineering company with €180 million in revenue received offers from both a domestic strategic buyer and a US private equity firm. The domestic offer valued the business at 9.2x EBITDA, while the US buyer's initial indication was 7.4x—a 20% discount explicitly attributed to "cross-border execution risk and regulatory uncertainty" in the buyer's valuation memorandum.
Earnout Structures and Risk Allocation
Earnout provisions have become significantly more prevalent, appearing in 47% of cross-border transactions in 2026 compared to 31% in 2023. These structures allow buyers and sellers to bridge valuation gaps created by geopolitical uncertainty:
In a $340 million acquisition of a US-based automotive supplier by a European strategic buyer, the structure included a $280 million upfront payment with a $60 million earnout tied to maintaining EBITDA margins above 16.5% over three years—explicitly designed to allocate tariff-related margin risk. The earnout was calibrated using scenario analysis incorporating three tariff regimes: baseline (current policy), escalation (+10 percentage points), and de-escalation (-5 percentage points).
Material Adverse Change (MAC) Clause Evolution
MAC clauses in 2026 purchase agreements have become more specific regarding geopolitical triggers. Standard language now frequently includes:
- Specific tariff rate thresholds (e.g., "tariffs exceeding 30% on products representing more than 20% of revenue")
- Sanctions list additions affecting material customer or supplier relationships
- Export control restrictions on critical technologies or markets
- Currency movement thresholds for deals involving emerging market exposure
This specificity has reduced post-signing litigation but increased negotiation complexity and due diligence requirements.
04 Cross-Border Transaction Volume Trends
The impact on deal flow has been pronounced but uneven:
Overall Volume Decline
Global cross-border M&A volume through September 2026 totaled $847 billion, representing a 23% decline from the equivalent period in 2024. However, this aggregate figure masks significant variation:
US-China corridor: Transaction volume has collapsed by 68%, with only $12.4 billion in announced deals compared to $38.7 billion in 2024. Technology and semiconductor transactions have virtually ceased, while consumer goods and healthcare deals continue at reduced levels.
Intra-European transactions: Volume has increased by 14%, as companies pursue regional consolidation strategies to achieve scale within the EU single market rather than pursuing riskier cross-border expansion.
US-Europe corridor: Down 31% overall, but with significant sector variation. Technology deals are down 52%, while renewable energy and healthcare transactions have declined only 18%.
Emerging Safe Havens
Certain jurisdictions have emerged as relative safe havens, attracting disproportionate investment:
- Singapore and UAE: Cross-border investment into these jurisdictions increased 34% and 41% respectively, as companies establish regional headquarters in politically neutral locations
- Mexico: Despite selective tariffs, nearshoring trends have driven a 27% increase in cross-border manufacturing investment, particularly from US and Asian companies seeking USMCA benefits
- India: Inbound M&A increased 29%, benefiting from its position as a China alternative and large domestic market
05 Sector-Specific Valuation Impacts: Case Studies
Energy Sector: The Middle East Premium
Ongoing regional instability has created a persistent risk premium in oil prices, fundamentally altering energy sector valuations. Upstream producers have seen median EV/EBITDA multiples expand from 6.4x in 2023 to 8.2x in 2026, while EV/proved reserves multiples have increased from $11.20/boe to $14.80/boe.
A recent valuation of a mid-sized US shale producer illustrates the methodology adjustments. The base case assumed Brent crude at $92/barrel with a geopolitical risk premium of $12-15/barrel embedded in the long-term price deck. However, the discount rate was simultaneously increased by 125 basis points to reflect heightened volatility and potential demand destruction from sustained high prices. The net effect was a 16% increase in enterprise value compared to a 2023 valuation framework, but 8% below what a simple commodity price increase would suggest without the discount rate adjustment.
Conversely, downstream refining and petrochemical businesses face margin compression from input cost volatility, with valuation multiples declining 15-20% for companies without effective hedging programs or long-term supply contracts.
Technology: The Decoupling Discount
Technology companies with significant China exposure face what practitioners are calling the "decoupling discount"—a structural valuation reduction reflecting permanent market access risk and supply chain bifurcation costs.
A semiconductor design company with 38% of revenue from China-based customers recently underwent a fairness opinion process for a potential sale. Three valuation approaches yielded dramatically different results:
- Comparable company analysis: 14.2x forward EBITDA (applying a 35% discount to pure-play domestic peers trading at 21.8x)
- Precedent transactions: 12.8x EBITDA (based on recent deals with similar China exposure)
- DCF analysis: Implied multiple of 11.4x (using WACC of 11.2% including 200bp geopolitical risk premium and scenario-weighted cash flows assuming 40% probability of further market access restrictions)
The fairness opinion concluded with a range of 12.0x-13.5x EBITDA, representing a 38-45% discount to domestic peers—a stark illustration of geopolitical risk quantification.
Manufacturing: Supply Chain Reconfiguration Costs
Industrial companies are incorporating substantial capital expenditure requirements for supply chain diversification into their valuations. A consumer electronics manufacturer with heavy China manufacturing exposure included $180 million in incremental capex over three years to establish alternative production in Vietnam and Mexico—representing 2.4x normalized annual capex and reducing NPV by approximately $140 million (12% of enterprise value) when discounted at the company's 9.4% WACC.
These reconfiguration costs are now standard adjustments in quality of earnings analyses and normalized EBITDA calculations for manufacturing businesses in tariff-exposed sectors.
06 Practical Frameworks for Advisors
Based on current market practice, we recommend the following framework for incorporating geopolitical risk into valuations:
Step 1: Geopolitical Risk Mapping
Conduct a comprehensive assessment across four dimensions:
- Revenue geography: Map revenue by country and assess each jurisdiction's political stability, trade policy trajectory, and sanctions risk
- Supply chain exposure: Identify critical suppliers and manufacturing locations, quantifying tariff exposure and alternative sourcing costs
- Regulatory fragmentation: Assess compliance costs and market access risks from diverging regulatory regimes
- Currency and repatriation risk: Evaluate foreign exchange exposure and capital control risks
Step 2: Scenario-Based Cash Flow Modeling
Develop multiple scenarios with assigned probabilities:
- Base case (50% probability): Current tariff and trade policy environment persists
- Escalation scenario (30% probability): Tariffs increase by 10-15 percentage points, additional sectors affected
- De-escalation scenario (20% probability): Negotiated tariff reductions, improved trade relations
Calculate probability-weighted cash flows and compare to deterministic base case to quantify the "risk-adjusted value gap."
Step 3: Multi-Layered Discount Rate Adjustment
Build up the cost of equity systematically:
Base CAPM: Risk-free rate + (Beta × Market risk premium)
Plus: Country risk premium: 50-300bp depending on exposure
Plus: Sector-specific geopolitical premium: 0-250bp
Plus: Company-specific factors: Size premium, liquidity adjustments
Document each adjustment with reference to market data (CDS spreads, equity volatility, transaction evidence) to support defensibility in fairness opinions and litigation contexts.
Step 4: Sensitivity Analysis and Stress Testing
Present valuation ranges showing impact of:
- ±100bp discount rate changes
- Alternative scenario probability weightings
- Tariff rate variations of ±10 percentage points
- Currency movements of ±15%
This transparency helps boards and transaction committees understand the uncertainty embedded in valuations and make informed risk-adjusted decisions.
The valuation profession in 2026 requires not just technical competence but geopolitical literacy. Advisors must synthesize political science, trade policy analysis, and financial modeling to deliver credible valuations in an uncertain world.
07 Regulatory and Disclosure Considerations
Financial reporting and disclosure requirements have evolved to reflect the materiality of geopolitical risks:
ASC 820 Fair Value Measurement
US GAAP requires that fair value measurements incorporate all information available to market participants. In 2026, this explicitly includes geopolitical risk factors. Companies performing goodwill impairment testing or purchase price allocation must document how tariffs, trade restrictions, and political risks affect their discount rate selections and cash flow projections. SEC comment letters have increasingly challenged companies that fail to adequately explain geopolitical risk adjustments.
IFRS 13 and European Enforcement
ESMA has issued guidance emphasizing that geopolitical risks affecting cash flows or discount rates must be transparently disclosed in financial statement notes. European companies with significant non-EU exposure face particular scrutiny regarding the adequacy of their risk disclosures and valuation methodologies.
CFIUS and National Security Reviews
The expansion of CFIUS jurisdiction and similar regimes in the EU, UK, and Australia has added 4-8 months to cross-border transaction timelines and introduced meaningful execution risk. Valuation analyses now routinely include probability-weighted adjustments for regulatory approval risk, typically reducing transaction values by 3-7% for deals requiring national security clearance.
08 Looking Ahead: Valuation in an Uncertain World
The geopolitical landscape of 2026 represents a structural shift rather than a cyclical phenomenon. The post-Cold War era of globalization and relatively frictionless cross-border commerce has given way to a more fragmented, multipolar world where political considerations increasingly override pure economic logic.
For valuation professionals, this environment demands continuous adaptation. The half-life of geopolitical assumptions has shortened dramatically—what seemed like a reasonable 10-year tariff scenario in January may be obsolete by June. This requires more frequent valuation updates, more sophisticated scenario planning, and closer collaboration between financial advisors and geopolitical risk consultants.
Several trends will likely intensify through 2027 and beyond:
- Regionalization of supply chains: Companies will continue to prioritize resilience over efficiency, accepting higher costs for reduced geopolitical exposure. This will create valuation premiums for businesses with diversified, flexible supply chains.
- Technology bifurcation: Separate technology ecosystems will emerge, requiring companies to maintain parallel product lines and R&D efforts for different markets—a permanent increase in operating costs that must be reflected in valuations.
- Increased use of real options analysis: Traditional DCF may prove insufficient for capturing the value of strategic flexibility in an uncertain environment. Real options frameworks that value the ability to pivot, exit, or expand will become more prevalent.
- Political risk insurance growth: The market for political risk insurance and trade credit insurance will expand, providing market-based pricing signals that can inform discount rate adjustments.
For M&A practitioners, the imperative is clear: geopolitical risk analysis must be integrated into every phase of the transaction lifecycle, from target screening through post-merger integration. Buyers who fail to adequately assess and price these risks will face post-closing surprises and value destruction. Sellers who cannot articulate their geopolitical risk mitigation strategies will face valuation discounts.
The complexity of this environment underscores the value of sophisticated analytical tools and platforms. Professional-grade solutions like iValuate enable advisors to efficiently model multiple scenarios, adjust discount rates with proper documentation, and generate defensible valuation ranges that reflect the full spectrum of geopolitical uncertainties. In an era where the difference between a well-supported and poorly-supported risk adjustment can represent tens of millions in enterprise value, the quality of analytical infrastructure matters more than ever.
The geopolitical risk premium is not merely a technical adjustment to a spreadsheet—it represents the quantification of fundamental uncertainty about the future of global commerce. As we navigate 2026 and beyond, the valuation professionals who master this challenge will deliver superior outcomes for their clients and stakeholders, while those who treat it as an afterthought will find their analyses increasingly disconnected from market reality.