Índice8 secciones
When a European middle-market software company trades at 8.5x EV/EBITDA while comparable US peers command 12-14x, is this a valuation opportunity or a fundamental market reality? For corporate finance professionals conducting cross-border valuations, understanding geographic adjustments to market multiples has become increasingly critical as capital flows globally but valuations remain stubbornly local.
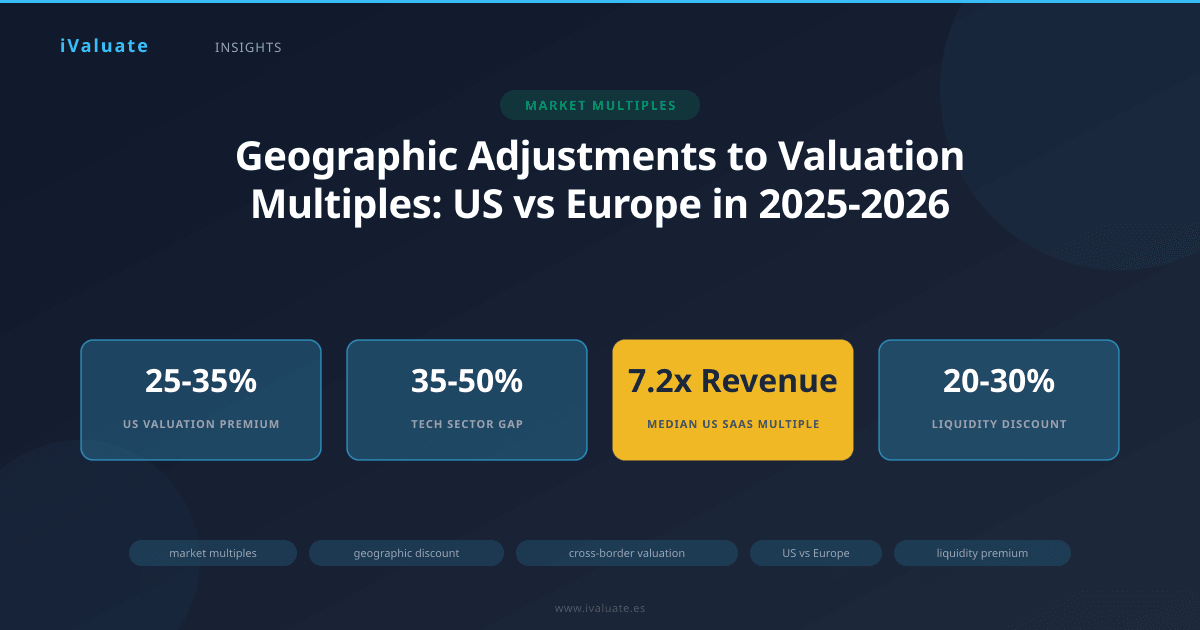
The persistent valuation gap between US and European companies represents one of the most significant—and often misunderstood—factors in international M&A and corporate valuation. As of Q1 2026, the median public company valuation multiple in the United States continues to trade at a 25-35% premium to European equivalents across most sectors, a spread that has remained remarkably consistent despite increasing market integration and cross-border capital flows.
01 The Structural Reality of Geographic Valuation Differences
The notion that valuation multiples can be seamlessly transferred across geographies represents a fundamental misunderstanding of how markets price assets. Geographic location affects valuation through multiple interconnected channels: market liquidity, investor base composition, regulatory environment, growth expectations, currency considerations, and exit optionality.
Consider the technology sector as an illustrative example. In 2025, US-listed software companies with $50-250 million in revenue traded at a median EV/Revenue multiple of 6.2x, while comparable European software companies traded at 4.1x—a 51% differential. This gap narrows somewhat when examining EBITDA multiples (14.2x vs 10.8x, a 31% differential), but remains economically significant across all commonly used metrics.
The Liquidity Premium and Market Depth
Market liquidity represents perhaps the single most important driver of geographic valuation differentials. The US equity markets offer unparalleled depth, with daily trading volumes in technology stocks alone exceeding the total market capitalization of many European exchanges. This liquidity translates directly into valuation premiums through several mechanisms.
First, liquid markets reduce execution risk for investors, allowing larger position sizes and faster entry and exit. A $500 million institutional investor can build a meaningful position in a $2 billion US company over several weeks without materially moving the stock price. The same investor attempting to acquire a similar position in a €1.5 billion European company might require months and face significant price impact.
Second, liquidity supports higher leverage multiples in M&A transactions. US strategic acquirers and financial sponsors can finance larger transactions with greater certainty, knowing they can syndicate debt, hedge currency exposure, and ultimately exit through liquid public markets or to well-capitalized buyers. This financing certainty translates into higher bid prices and, by extension, higher trading multiples for public comparables.
The liquidity premium can be quantified through bid-ask spread analysis and trading volume metrics. As of early 2026, the average bid-ask spread for S&P 500 companies stands at 0.08%, compared to 0.23% for STOXX Europe 600 constituents—a nearly 3x differential. For mid-cap companies, this gap widens further, with US mid-caps averaging 0.31% spreads versus 0.89% for European equivalents.
The liquidity premium embedded in US multiples typically ranges from 15-25% for large-cap companies and 25-40% for mid-cap companies when compared to European peers. This premium must be explicitly adjusted when applying US multiples to European valuation targets.
Investor Base and Capital Market Structure
The composition and behavior of the investor base fundamentally shapes valuation levels. US markets benefit from a massive domestic institutional investor base with $30+ trillion in assets under management, including pension funds, endowments, and mutual funds with explicit mandates to deploy capital in growth-oriented equities. This creates sustained demand for quality assets and supports premium valuations.
European markets, while sophisticated, operate with a more fragmented investor base across multiple countries, currencies, and regulatory regimes. The absence of a truly unified European capital market means that a German Mittelstand company may struggle to attract French or Italian institutional investors, limiting demand and compressing multiples.
Furthermore, US investors demonstrate a higher tolerance for growth-oriented business models with delayed profitability. The willingness to pay premium multiples for revenue growth, even at the expense of near-term earnings, remains more pronounced in US markets. European investors, influenced by different accounting traditions and investment cultures, typically demand clearer paths to profitability and cash generation, resulting in more conservative multiple application.
02 Quantifying the Geographic Discount: A Framework
Translating these qualitative differences into quantitative adjustments requires a structured analytical framework. Professional valuators typically employ a multi-factor approach that considers company-specific characteristics, sector dynamics, and market conditions.
The Base Geographic Adjustment
Start with sector-specific median multiple data from both geographies. For a European company, the base geographic adjustment can be calculated as:
Geographic Discount = 1 - (European Median Multiple / US Median Multiple)
For example, if US industrial distribution companies trade at a median EV/EBITDA of 11.2x and European equivalents trade at 8.4x, the base geographic discount is 25% (1 - 8.4/11.2). This discount should be calculated using the most relevant multiple for the subject company—typically EV/EBITDA for mature businesses and EV/Revenue for high-growth companies.
However, this base calculation represents only the starting point. Company-specific factors can either widen or narrow this discount significantly.
Liquidity and Size Adjustments
Within each geographic market, company size correlates strongly with valuation multiples. A $5 billion European company will trade closer to US valuations than a $200 million European company, reflecting greater liquidity, analyst coverage, and index inclusion.
For private company valuations, an additional liquidity discount of 20-30% is typically applied to public company multiples, regardless of geography. When valuing a private European company using US public comparables, both the geographic discount and the liquidity discount must be applied, though not necessarily in simple multiplicative fashion.
A practical approach: For European companies with enterprise values below €500 million, apply the full geographic discount. For companies between €500 million and €2 billion, reduce the geographic discount by 20-30%. For companies above €2 billion with international operations, the geographic discount may narrow to 10-15%.
Growth Rate Normalization
US companies often trade at premium multiples partly because they operate in a larger, more homogeneous market with greater growth potential. A US software company might reasonably project 25-30% annual growth for several years based on domestic market opportunity alone. A comparable European company faces market fragmentation, multiple languages, and varied regulatory regimes that constrain growth rates.
When applying US multiples to European companies, adjust for realistic growth differentials. If US comparables are growing at 28% annually and the European target can sustain 18% growth, a multiple adjustment of 20-25% may be warranted, depending on the sector's growth sensitivity.
The relationship between growth and multiples is not linear but typically follows a power function. In the software sector, for example, companies growing above 30% annually command multiples 2-3x higher than those growing at 15%, all else equal. This growth-multiple sensitivity must inform geographic adjustments.
03 Sector-Specific Considerations
Geographic discounts vary significantly by sector, reflecting different competitive dynamics, regulatory environments, and growth trajectories.
Technology and Software
The technology sector exhibits the widest geographic valuation gaps, with US companies trading 35-50% above European peers as of 2025-2026. This reflects the US market's dominance in technology innovation, the presence of strategic acquirers willing to pay premium prices, and the concentration of venture capital and growth equity funding.
For European SaaS companies, a typical adjustment framework might apply a 35-40% discount to US public SaaS multiples for companies under €100 million in revenue, narrowing to 20-25% for companies above €250 million with demonstrated international expansion. High-growth European SaaS companies with 40%+ growth rates and strong unit economics may justify discounts at the lower end of this range.
Industrial and Manufacturing
Industrial companies show narrower geographic discounts, typically 15-25%, reflecting the more global nature of industrial markets and the presence of strong European industrial champions. German engineering companies, Italian machinery manufacturers, and French aerospace suppliers often command valuations approaching US levels when they hold leading market positions and demonstrate export strength.
For industrial valuations, focus on EBITDA multiples rather than revenue multiples, as profitability matters more in mature industrial sectors. A European industrial company with 15%+ EBITDA margins and strong market positions might justify only a 10-15% discount to US comparables.
Healthcare and Life Sciences
Healthcare valuations show moderate geographic discounts of 20-30%, influenced by regulatory differences, reimbursement systems, and R&D productivity. European pharmaceutical and medical device companies with global regulatory approvals and US market presence trade closer to US valuations than purely domestic players.
For medical device companies, US multiples averaged 16.8x EV/EBITDA in Q4 2025, while European equivalents traded at 12.9x—a 23% discount. However, European companies with FDA approvals and established US distribution traded at only a 12-15% discount, demonstrating how specific company characteristics can override geographic factors.
04 Real-World Application: Three Case Studies
Case Study 1: European B2B Software Company
A French B2B software company with €45 million in ARR, growing at 22% annually, sought valuation guidance for a potential sale. US public SaaS comparables traded at a median 7.2x EV/Revenue. The valuation team applied a structured adjustment:
- Base US multiple: 7.2x
- Geographic discount (35% for sub-€100M software): -2.5x
- Growth adjustment (22% vs 28% US median): -0.4x
- Adjusted multiple: 4.3x
- Liquidity discount for private company (25%): -1.1x
- Final applied multiple: 3.2x
This yielded a valuation of €144 million. The company ultimately sold for €152 million (3.4x revenue) to a US strategic buyer, validating the framework while demonstrating that strategic value can exceed financial buyer valuations.
Case Study 2: German Industrial Distribution Business
A German industrial distribution company with €180 million in revenue and €22 million in EBITDA sought valuation for estate planning purposes. US industrial distribution comparables traded at 10.8x EV/EBITDA. The analysis proceeded as follows:
- Base US multiple: 10.8x
- Geographic discount (20% for industrial, mid-size): -2.2x
- Profitability premium (12.2% EBITDA margin vs 9.8% US median): +0.6x
- Adjusted public multiple: 9.2x
- Liquidity discount (25%): -2.3x
- Final applied multiple: 6.9x
This suggested a valuation of €152 million. Subsequent discussions with financial sponsors indicated interest at 7.2-7.8x EBITDA, reflecting competitive tension and the company's market position.
Case Study 3: UK Healthcare Services Provider
A UK-based healthcare services provider with £85 million in revenue and £12 million in EBITDA required valuation for a minority investment. US healthcare services companies traded at 13.2x EV/EBITDA. The valuation incorporated:
- Base US multiple: 13.2x
- Geographic discount (25% for healthcare services): -3.3x
- Regulatory risk adjustment (NHS dependency): -0.8x
- Growth premium (18% vs 12% sector median): +1.2x
- Adjusted multiple: 10.3x
For a minority stake in a private company, an additional 15% discount for lack of control and 20% for illiquidity yielded a final multiple of approximately 7.0x, suggesting a £84 million valuation for the enterprise.
05 Currency Considerations and Cross-Border Dynamics
Geographic adjustments must also account for currency risk and cross-border transaction dynamics. When a US buyer acquires a European company, currency fluctuations between deal signing and closing can materially impact economics. The EUR/USD exchange rate volatility of 8-12% annually creates real risk that sophisticated buyers price into their bids.
Additionally, cross-border transactions face regulatory scrutiny, tax structuring complexity, and integration challenges that domestic deals avoid. These factors typically result in a 5-10% valuation discount for cross-border transactions, separate from pure geographic market differences.
However, currency considerations can also work in favor of European sellers. When the euro weakens against the dollar, European assets become relatively cheaper for US buyers, potentially increasing demand and supporting valuations. The 2023-2024 period, with EUR/USD trading in the 1.05-1.10 range, saw increased US buyer activity in Europe, partially offsetting traditional geographic discounts.
06 The Role of Market Conditions and Timing
Geographic discounts are not static but vary with market cycles, interest rates, and cross-border capital flows. During periods of US market exuberance, the valuation gap widens as US multiples expand faster than European equivalents. Conversely, during US market corrections, European valuations often prove more resilient, narrowing the gap.
The 2025-2026 period has seen relatively stable geographic discounts following the volatility of 2022-2023. With US interest rates stabilizing around 4.0-4.5% and European rates at 3.0-3.5%, the interest rate differential supports continued US valuation premiums, though less dramatically than during the zero-rate environment of 2020-2021.
Private equity activity provides a useful barometer for geographic valuation trends. US buyout funds deployed €47 billion in European acquisitions in 2025, up 23% from 2024, suggesting that sophisticated financial buyers see value in European assets at current valuation levels. The median EV/EBITDA multiple paid by US PE firms for European companies in 2025 was 9.8x, compared to 11.4x for US deals—a 14% differential that represents the "smart money" view on appropriate geographic adjustments.
07 Practical Implementation for Valuation Professionals
When conducting valuations that require geographic adjustments, follow this systematic approach:
Step 1: Establish the Base Multiple
Identify truly comparable companies in the US market, matching on size, growth, profitability, and business model. Calculate median and quartile multiples across your comparable set. Use multiple valuation metrics (EV/Revenue, EV/EBITDA, P/E) to triangulate value.
Step 2: Quantify the Geographic Discount
Research sector-specific European comparables to establish the empirical discount. If European public comparables are limited, analyze recent M&A transactions involving European targets. Apply base discounts of 20-25% for most sectors, 35-40% for technology, and 15-20% for industrials.
Step 3: Adjust for Company-Specific Factors
Modify the base discount based on company size, growth rate, profitability, international presence, and competitive position. Larger, faster-growing, more profitable companies justify smaller discounts. Companies with significant US operations may warrant minimal geographic adjustment.
Step 4: Apply Liquidity Discounts
For private companies, apply appropriate liquidity discounts (20-30%) after geographic adjustments. Consider the specific circumstances: a company in active sale process with multiple bidders requires smaller liquidity discounts than a company with no near-term exit prospects.
Step 5: Sense-Check and Triangulate
Compare your adjusted multiples to recent transaction data for similar European companies. Validate that your conclusion falls within reasonable bounds. If your adjusted multiple suggests a valuation significantly above or below recent market transactions, revisit your assumptions.
Professional valuators increasingly use specialized tools and databases to streamline geographic adjustments and ensure consistency. Platforms like iValuate provide access to global comparable company data, transaction multiples, and adjustment frameworks that help professionals apply rigorous, defensible geographic adjustments efficiently.
08 Looking Forward: Convergence or Continued Divergence?
The question of whether geographic valuation gaps will narrow or persist shapes long-term investment strategy and cross-border M&A activity. Several forces suggest potential convergence: increasing cross-border capital flows, European capital markets union initiatives, the growth of pan-European tech champions, and the maturation of European venture capital and growth equity markets.
However, structural factors supporting US valuation premiums remain firmly in place. The US market's scale, liquidity, innovation ecosystem, and risk capital availability create self-reinforcing advantages unlikely to dissipate quickly. The dollar's reserve currency status, the depth of US institutional investor base, and the country's track record of creating global technology leaders all support continued valuation premiums.
For 2026 and beyond, expect geographic discounts to persist in the 20-35% range for most sectors, with potential narrowing for large-cap companies and those with strong international operations. Technology companies will likely continue showing the widest gaps, while industrial and healthcare companies may see modest convergence as European champions expand globally.
The practical implication for valuation professionals is clear: geographic adjustments will remain a critical component of cross-border valuation work for the foreseeable future. Mastering the frameworks, data sources, and judgment calls required to make these adjustments accurately represents an essential skill for anyone conducting international valuations.
As capital markets evolve and companies operate increasingly globally, the tools and methodologies for geographic adjustments must evolve as well. Platforms like iValuate help professionals stay current with market data, apply consistent adjustment frameworks, and deliver defensible valuations that reflect the complex realities of global markets. In an environment where a 25% valuation adjustment can represent tens or hundreds of millions of euros in deal value, getting geographic adjustments right has never been more important.