Índice9 secciones
When a buyer acquires a controlling interest in a company, they typically pay a significant premium over the trading price of minority shares or the fair market value of a non-controlling interest. This control premium reflects the additional value associated with the ability to direct corporate strategy, appoint management, declare dividends, and make fundamental business decisions. For valuation professionals, accurately quantifying control premiums is essential for pricing transactions, fairness opinions, and litigation support.
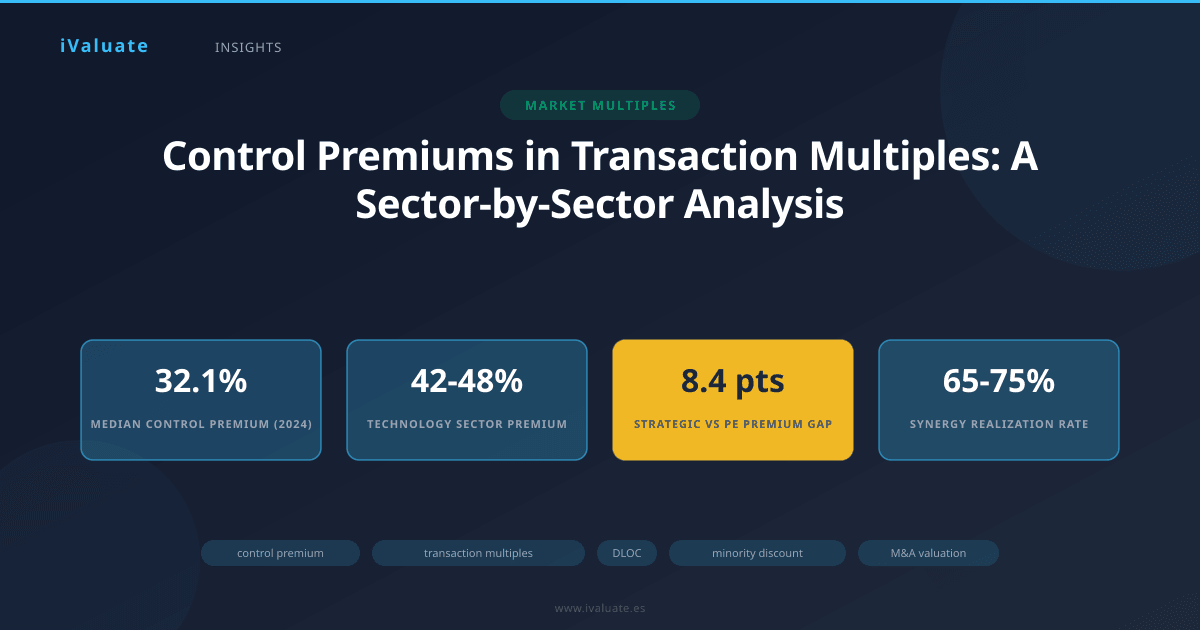
In the current M&A environment of 2025-2026, control premiums have remained robust despite economic uncertainty. According to FactSet's Mergerstat data, median control premiums for U.S. public company acquisitions averaged 32.1% in 2024, measured as the premium over the target's stock price one day prior to announcement. However, this headline figure masks substantial variation across sectors, deal structures, and strategic rationales.
This article examines how control premiums are quantified in transaction multiples, explores the theoretical and practical drivers of these premiums, and provides sector-specific benchmarks that valuation professionals can use to assess whether a proposed premium falls within market norms or requires special justification.
01 The Theoretical Foundation of Control Premiums
The control premium represents the incremental value that accrues to a controlling shareholder relative to a minority position. This concept is intrinsically linked to the discount for lack of control (DLOC), which represents the percentage reduction in value for a minority interest that cannot influence corporate decisions.
Mathematically, the relationship between control premiums and DLOC is expressed as:
Control Premium = 1 / (1 - DLOC) - 1
For example, if the DLOC is 25%, the corresponding control premium would be 33.3% (1/0.75 - 1). This non-linear relationship is critical: a 20% DLOC corresponds to a 25% control premium, while a 30% DLOC translates to a 42.9% control premium.
Sources of Control Value
Control premiums derive from several distinct value sources:
- Strategic redirection: The ability to change business strategy, enter new markets, or exit underperforming segments
- Operational improvements: Implementation of best practices, cost reduction initiatives, or efficiency gains
- Financial restructuring: Optimization of capital structure, dividend policy, or asset deployment
- Synergies: Revenue enhancements or cost savings achievable through combination with the acquirer's operations
- Management changes: Replacement of underperforming executives or alignment of incentives
- Asset redeployment: Sale of non-core assets or monetization of underutilized resources
It's crucial to distinguish between control premiums that reflect general control rights versus those driven by buyer-specific synergies. The former represents a market-based control premium applicable to any control buyer, while the latter reflects investment value specific to a particular acquirer.
02 Measuring Control Premiums in Transaction Multiples
Valuation professionals typically measure control premiums through several methodologies, each with distinct applications and limitations.
Premium Over Market Price Method
For publicly traded targets, the most straightforward measurement compares the acquisition price to the target's unaffected stock price. Market practice examines premiums over various time horizons:
- One-day premium: Price paid versus closing price one day before announcement
- One-week premium: Price versus average closing price during the week before announcement
- Four-week premium: Price versus average closing price during the four weeks before announcement
The one-day premium is most commonly cited, but the four-week premium often provides a better measure of the true control premium by smoothing out short-term volatility and reducing the impact of information leakage. In 2024, the median four-week premium for U.S. deals was 35.8%, approximately 3.7 percentage points higher than the one-day premium.
Comparable Transaction Analysis
When valuing private companies or minority interests, professionals often apply control premiums derived from comparable public company acquisitions. This involves:
- Identifying relevant transactions in similar industries and size ranges
- Calculating the premiums paid in those transactions
- Adjusting for differences in growth rates, profitability, and market conditions
- Applying an appropriate premium to the subject company's minority interest value
This method requires careful consideration of comparability factors. A technology company with 40% revenue growth deserves a different control premium than a mature industrial business growing at 3% annually, even within the same sector.
Restricted Stock and Pre-IPO Studies
Academic research has long used restricted stock studies to quantify minority discounts, which can be inverted to estimate control premiums. However, these studies typically indicate minority discounts of 20-30%, suggesting control premiums of 25-43%. These figures often serve as a theoretical floor rather than a direct transaction pricing guide.
03 Sector-Specific Control Premium Analysis
Control premiums vary substantially across industries, reflecting differences in consolidation dynamics, regulatory environments, growth prospects, and the potential for operational improvements.
Technology and Software
The technology sector consistently commands the highest control premiums, averaging 42-48% in 2024-2025. Several factors drive these elevated premiums:
- Rapid technological change creates opportunities for strategic redirection
- Talent acquisition and retention are critical, requiring control over compensation and culture
- Platform integration and ecosystem effects generate substantial synergies
- High growth rates mean control over reinvestment decisions has outsized value impact
Software-as-a-Service (SaaS) companies have seen particularly robust premiums, with median four-week premiums of 51% in 2024. Strategic buyers in this space often pay for the ability to cross-sell products, integrate platforms, and accelerate customer acquisition—benefits that accrue only to a control buyer.
Case Example: In a representative 2024 transaction, a leading enterprise software company acquired a mid-market cybersecurity firm at a 56% premium to the four-week average stock price. The acquirer justified the premium based on projected revenue synergies of $120 million over three years, representing 18% of the target's standalone revenue. The control premium enabled the buyer to integrate the cybersecurity capabilities into its existing platform and mandate product bundling across the combined sales force.
Healthcare and Pharmaceuticals
Healthcare transactions averaged 35-40% control premiums in 2024, with significant variation between subsectors. Pharmaceutical companies typically see premiums of 30-35%, while healthcare services and medical device companies command 38-45%.
The healthcare sector's premiums reflect:
- Regulatory complexity requiring control over compliance and approval strategies
- Pipeline development decisions with binary outcomes
- Pricing power and reimbursement negotiations
- Consolidation-driven economies of scale in services delivery
Notably, biotech acquisitions often exhibit bimodal premium distributions. Companies with late-stage pipeline assets command premiums of 50-70%, while earlier-stage companies may see premiums of only 20-30%, reflecting higher uncertainty and the option value embedded in minority positions.
Financial Services
Banks and financial institutions averaged 28-32% control premiums in 2024-2025, below the market average. This relatively modest premium reflects:
- Regulatory constraints on post-acquisition restructuring
- Limited operational synergies due to standardized processes
- Transparent financial reporting reducing information asymmetries
- Regulatory approval requirements that limit buyer universe
However, fintech acquisitions by traditional financial institutions have commanded significantly higher premiums (45-55%), as incumbents pay for technology capabilities, customer acquisition channels, and the ability to accelerate digital transformation initiatives.
Industrial and Manufacturing
Industrial sector transactions averaged 30-34% control premiums in 2024, closely tracking the overall market. These premiums primarily reflect:
- Operational improvement opportunities through lean manufacturing and automation
- Supply chain optimization and vertical integration benefits
- Geographic expansion and market access
- Consolidation-driven pricing power in fragmented markets
Capital-intensive industries within this sector (aerospace, automotive suppliers) tend toward the lower end of the range (28-31%), while specialized manufacturing and industrial technology companies command higher premiums (36-42%).
Consumer and Retail
Consumer sector premiums averaged 31-36% in 2024, with notable divergence between traditional retail (26-30%) and direct-to-consumer digital brands (40-48%). The control premium in consumer businesses primarily reflects:
- Brand portfolio optimization and rationalization
- Distribution channel control and omnichannel integration
- Marketing efficiency and customer data utilization
- Supply chain and procurement synergies
Case Example: A 2025 acquisition of a premium consumer packaged goods company illustrated the importance of distribution control. The buyer, a global consumer conglomerate, paid a 44% premium justified largely by its ability to expand the target's products into 47 international markets where the target had no presence. The acquirer's financial advisors quantified the value of distribution control at approximately 60% of the total premium paid.
Energy and Natural Resources
Energy sector premiums have been volatile, ranging from 22-38% depending on commodity price environments. In the stabilized pricing environment of 2024-2025, premiums averaged 27-31%. Control value in this sector derives from:
- Reserve development and extraction strategy optimization
- Capital allocation across exploration, development, and return of capital
- Hedging strategy and risk management
- Regulatory and environmental compliance approach
Renewable energy transactions have commanded higher premiums (38-44%) as strategic buyers value control over development pipelines and the ability to integrate renewable assets into broader decarbonization strategies.
04 Transaction Structure and Premium Variation
Control premiums vary not only by sector but also by deal structure and buyer type.
Strategic versus Financial Buyers
Strategic buyers consistently pay higher control premiums than financial buyers. In 2024, strategic acquirers paid median premiums of 34.7% compared to 26.3% for private equity buyers. This 8.4 percentage point differential reflects strategic buyers' ability to realize operational synergies unavailable to financial buyers.
However, financial buyers have narrowed this gap in recent years through buy-and-build strategies and operational value creation capabilities. Platform acquisitions by private equity firms now command premiums of 28-32%, while add-on acquisitions to existing portfolio companies achieve premiums of 32-38%, approaching strategic buyer levels.
Tender Offers versus Negotiated Transactions
Hostile tender offers and competitive auction processes generate higher premiums than negotiated bilateral transactions. In 2024:
- Hostile tender offers: 41% median premium
- Competitive auctions: 37% median premium
- Negotiated bilateral deals: 29% median premium
This premium differential reflects both competitive dynamics and the target board's leverage in extracting maximum value for shareholders.
All-Cash versus Stock Consideration
All-cash transactions averaged 33.8% premiums in 2024, compared to 29.4% for all-stock deals and 31.6% for mixed consideration. Cash transactions typically command higher premiums because:
- Cash provides certainty of value to target shareholders
- Stock deals involve execution risk and market volatility
- Cash transactions often signal buyer confidence and financial strength
- Tax considerations may favor cash in certain situations
05 Quantifying Control Premiums: A Practical Framework
For valuation professionals assessing whether a proposed control premium is reasonable, a structured analytical framework is essential.
Step 1: Establish the Minority Interest Baseline
Begin with a robust minority interest valuation using appropriate methodologies:
- Public company trading multiples for comparable minority interests
- Discounted cash flow analysis reflecting minority shareholder rights
- Prior minority transactions in the subject company or comparables
This baseline represents the value absent control rights and buyer-specific synergies.
Step 2: Identify and Quantify Control Rights Value
Systematically evaluate the value of general control rights available to any control buyer:
- Strategic flexibility and redirection options
- Management and board composition control
- Dividend and capital allocation authority
- Asset deployment and divestiture rights
- Financial policy optimization
This analysis should reference market-based control premiums for comparable transactions, adjusted for company-specific factors.
Step 3: Quantify Buyer-Specific Synergies
Separately identify and value synergies unique to the specific buyer:
- Revenue synergies from cross-selling, market access, or pricing power
- Cost synergies from elimination of redundancies and scale economies
- Financial synergies from tax optimization or cost of capital reduction
Best practice involves detailed, bottoms-up synergy quantification with realistic implementation timelines and costs. In 2024, acquirers typically realized 65-75% of projected synergies, suggesting conservative estimates are appropriate.
Step 4: Reconcile to Market Benchmarks
Compare the implied total premium (control rights plus synergies) to market benchmarks:
- Sector-specific median and quartile premiums
- Premiums for comparable transactions by deal size and structure
- Historical premiums adjusted for current market conditions
Significant deviations from benchmarks require explicit justification and documentation.
06 Common Pitfalls in Control Premium Analysis
Valuation professionals should be alert to several common errors in control premium analysis:
Double-Counting Synergies
The most frequent mistake is including buyer-specific synergies in both the valuation multiple and the control premium. If transaction multiples are derived from acquisitions that included synergies, applying an additional control premium for those same synergies results in double-counting.
Best practice: Use minority interest multiples as the baseline and separately add the control premium, or use transaction multiples that already embed control premiums but don't add an incremental premium.
Ignoring Minority Rights
Not all minority positions are equal. Minority shareholders in some jurisdictions or corporate structures possess significant rights (board representation, veto rights, tag-along provisions) that reduce the applicable control premium. The analysis must account for the specific rights profile of the minority interest being valued.
Overlooking Market Conditions
Control premiums are not static. They fluctuate with M&A market conditions, interest rates, and economic cycles. In the elevated interest rate environment of 2024-2025, control premiums compressed modestly (by approximately 2-3 percentage points) compared to the 2020-2021 period, reflecting higher discount rates and more conservative buyer assumptions.
Failing to Distinguish Control from Synergies
For litigation and tax purposes, it's often critical to distinguish between the portion of the premium attributable to general control rights (applicable to any buyer) versus buyer-specific synergies. This distinction affects the fair market value standard in many contexts.
07 Regulatory and Tax Considerations
Control premium analysis intersects with numerous regulatory and tax issues that valuation professionals must navigate.
Tax Court Precedents
U.S. Tax Court cases have established important precedents regarding control premiums in estate and gift tax valuations. The court has generally held that fair market value assumes a hypothetical willing buyer and seller, which may or may not include control premiums depending on the specific facts and circumstances.
In the landmark Estate of Jelke v. Commissioner case, the court applied a control premium to a controlling interest but noted that the premium must reflect what a hypothetical buyer would pay, not necessarily what a specific strategic buyer might pay for synergies.
Financial Reporting Implications
Under ASC 805 (Business Combinations), acquirers must allocate purchase price to identifiable assets and goodwill. The control premium paid often manifests as goodwill, but proper allocation requires identifying whether premium components relate to:
- Assembled workforce (not separately recognized)
- Customer relationships (recognized as intangible assets)
- Technology and intellectual property (recognized as intangible assets)
- Synergies and going concern value (goodwill)
This allocation has significant implications for future amortization and impairment testing.
08 The Future of Control Premiums: 2025-2026 Outlook
Several trends are shaping control premium dynamics in the current market environment:
Technology-Driven Disruption
As artificial intelligence and automation reshape industries, control premiums for companies with proprietary technology or data assets are expanding. Buyers increasingly value the ability to control technology roadmaps and integration strategies, driving premiums in the technology sector to new highs.
ESG and Stakeholder Governance
The rise of stakeholder capitalism and ESG considerations is creating new dimensions of control value. Buyers who can credibly commit to ESG improvements may justify higher premiums, particularly in sectors facing regulatory or reputational pressures around sustainability.
Regulatory Scrutiny
Increased antitrust enforcement in the U.S. and Europe is affecting control premiums in concentrated industries. Transactions requiring extensive regulatory approval processes have seen premiums compress by 3-5 percentage points due to execution risk and potential remedy requirements.
Private Equity Evolution
As private equity firms develop sophisticated operational capabilities and sector expertise, the premium differential between strategic and financial buyers continues to narrow. This convergence is particularly evident in healthcare, technology, and business services sectors.
09 Conclusion: Precision in Premium Analysis
Control premiums represent one of the most significant and complex adjustments in corporate valuation. The 28-35% range often cited as a market average masks substantial variation driven by sector dynamics, deal structure, buyer type, and company-specific factors. Valuation professionals must move beyond generic premium assumptions to develop rigorous, defensible analyses grounded in comparable transaction data, synergy quantification, and theoretical frameworks.
The distinction between general control rights and buyer-specific synergies remains critical for tax, litigation, and fairness opinion work. As M&A markets evolve and new value drivers emerge—from AI capabilities to ESG performance—the components of control premiums will continue to shift, requiring ongoing market monitoring and analytical refinement.
For CFOs evaluating acquisition opportunities, understanding sector-specific control premium benchmarks provides essential context for assessing whether a proposed price falls within market norms or requires special justification to boards and shareholders. For M&A advisors, robust control premium analysis strengthens fairness opinions and enhances credibility with clients and regulators.
Key Takeaway: Control premiums are not one-size-fits-all. Technology companies command 42-48% premiums while financial services average 28-32%. Rigorous analysis requires sector-specific benchmarks, clear distinction between control rights and synergies, and adjustment for deal structure and market conditions.
In an environment where transaction multiples face scrutiny from boards, shareholders, and regulators, precision in control premium analysis has never been more important. Professional valuation platforms like iValuate enable practitioners to efficiently access comparable transaction databases, apply sector-specific benchmarks, and generate defensible control premium analyses that withstand the rigorous examination these critical adjustments demand.