Índice11 secciones
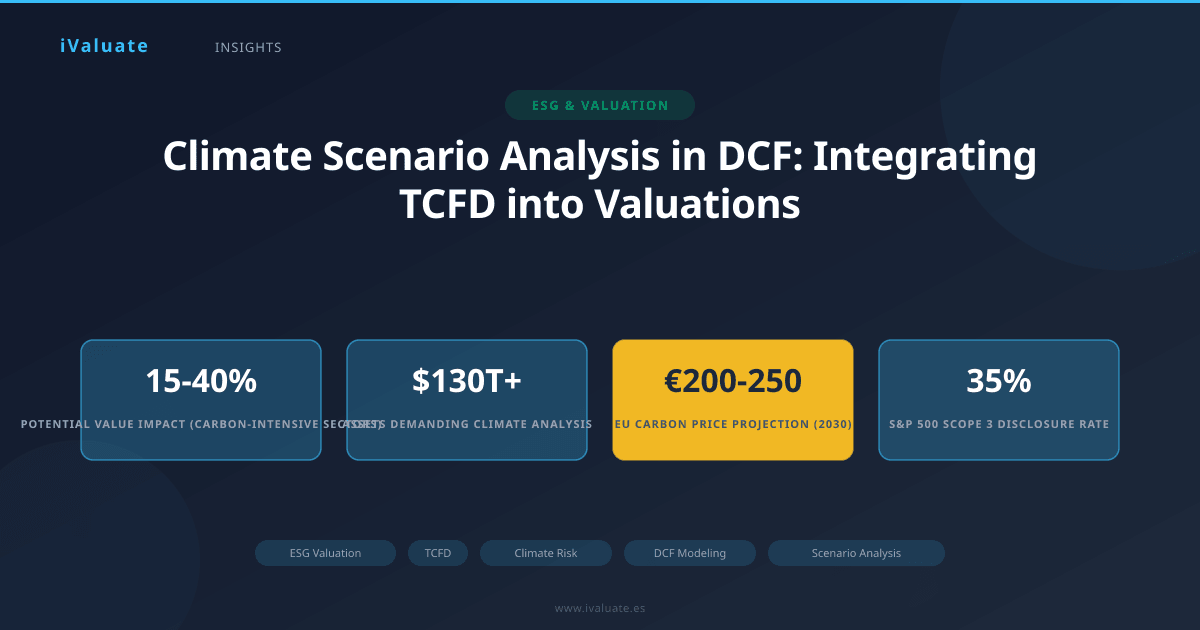
The integration of climate risk into corporate valuation has evolved from a peripheral ESG consideration to a core component of rigorous financial analysis. As of 2025, institutional investors managing over $130 trillion in assets now demand quantified climate scenario analysis in investment decisions, and regulators across major jurisdictions have codified climate disclosure requirements. For valuation professionals, this shift necessitates a fundamental rethinking of how we construct discounted cash flow (DCF) models, particularly regarding long-term cash flow projections that extend beyond traditional five-year forecast horizons.
The Task Force on Climate-related Financial Disclosures (TCFD) framework, established by the Financial Stability Board in 2015 and now embedded in IFRS sustainability disclosure standards (ISSB S2), provides the methodological foundation for this integration. The framework requires organizations to assess resilience across multiple climate scenarios, including pathways aligned with temperature increases of 1.5°C, 2°C, and 3°C or higher. For valuators, translating these scenarios into quantified impacts on revenue, costs, capital expenditure, and discount rates represents both a technical challenge and a professional imperative.
01 The TCFD Framework and Valuation Implications
TCFD's scenario analysis framework distinguishes between two fundamental categories of climate-related financial risk: physical risks and transition risks. Physical risks encompass the direct impacts of climate change—acute events like hurricanes and floods, and chronic shifts such as rising sea levels and temperature changes. Transition risks arise from the shift toward a lower-carbon economy, including policy changes, technological disruption, market shifts, and reputational impacts.
Recent empirical research quantifies the materiality of these risks. A 2024 study by the Network for Greening the Financial System (NGFS) analyzing 4,000 publicly traded companies found that under a disorderly transition scenario (delayed action followed by abrupt policy changes), enterprise values could decline by 15-25% for carbon-intensive sectors by 2030, with impacts reaching 35-40% by 2050. Conversely, companies positioned to benefit from the transition—renewable energy providers, electric vehicle manufacturers, green building materials producers—showed potential value uplifts of 20-50% under orderly transition scenarios.
For DCF practitioners, these findings underscore a critical point: climate scenarios are not merely disclosure exercises but fundamental drivers of intrinsic value that must be systematically incorporated into cash flow projections and risk assessments.
02 Methodological Framework for Climate-Adjusted DCF Models
Scenario Selection and Probability Weighting
The first technical decision involves selecting appropriate climate scenarios. The NGFS provides six core scenarios ranging from "Net Zero 2050" (limiting warming to 1.5°C through immediate coordinated action) to "Current Policies" (3°C+ warming with minimal additional climate action). Leading valuation practices in 2025-2026 typically model three scenarios:
- Orderly Transition (1.5-2°C): Immediate policy action, smooth technological adoption, carbon prices reaching $200-250/tCO2e by 2030 in developed markets
- Disorderly Transition (1.5-2°C): Delayed action until late 2020s, followed by abrupt policy shifts and higher transition costs
- Hot House World (3°C+): Limited policy action, severe physical impacts, particularly post-2040
Rather than selecting a single "base case," sophisticated valuations now employ probability-weighted scenario analysis. Current market practice assigns approximate probabilities of 30-40% to orderly transition, 30-40% to disorderly transition, and 20-30% to hot house scenarios, though these weights vary significantly by geography and sector. The weighted average of scenario-specific valuations provides a more robust estimate of fair value than traditional single-path DCF models.
Revenue Impact Modeling
Climate scenarios affect revenue through multiple transmission mechanisms. For a European automotive manufacturer valued in early 2026, our analysis might incorporate:
Transition Risk Revenue Impacts:
- Regulatory phase-outs of internal combustion engine (ICE) vehicles accelerating under orderly/disorderly scenarios, with EU effectively banning new ICE sales by 2035
- Market share shifts as consumer preferences evolve, with battery electric vehicle (BEV) penetration reaching 65-75% of new sales by 2030 in orderly scenarios versus 45-55% in disorderly scenarios
- Pricing pressure on legacy ICE inventory as residual values decline 15-25% faster than historical norms
- Revenue opportunities from electric powertrains, with average selling prices for BEVs commanding 20-30% premiums through 2028 before converging with ICE pricing
Physical Risk Revenue Impacts:
- Supply chain disruptions from extreme weather affecting production volumes, with hot house scenarios showing 3-5% annual revenue volatility from climate-related disruptions by 2035
- Demand impacts in heat-stressed regions, particularly for vehicles without advanced climate control, affecting 8-12% of emerging market sales under 3°C+ scenarios
Quantitatively, this might translate to revenue CAGR assumptions of 4.5% under orderly transition (benefiting from early BEV leadership), 2.8% under disorderly transition (higher costs delaying market share gains), and 1.2% under hot house scenarios (physical disruptions and delayed transition creating competitive disadvantages).
Operating Cost Adjustments
Climate scenarios materially impact cost structures through carbon pricing, energy costs, and adaptation expenditures. For the same automotive manufacturer:
Carbon Pricing: Under orderly transition scenarios, EU carbon prices reach €180-200/tCO2e by 2030 (versus €85/tCO2e in early 2025). For a manufacturer emitting 2.5 million tCO2e annually across Scope 1 and 2, this represents €450-500 million in annual carbon costs by 2030, or approximately 3-4% of revenue. Disorderly scenarios show even higher peak carbon prices (€250-300/tCO2e) during the 2032-2038 period as delayed action creates supply-demand imbalances.
Energy Costs: Transition scenarios drive renewable energy cost declines (solar/wind LCOE falling 30-40% by 2030) but also create grid instability costs during the transition period. Companies with long-term renewable power purchase agreements benefit from cost certainty, while those reliant on spot markets face 15-25% higher volatility in disorderly scenarios.
Physical Adaptation: Hot house scenarios require significant adaptation investments—enhanced cooling systems, flood protection for facilities, supply chain redundancy. These costs typically emerge post-2035 but can reach 1-2% of revenue annually for companies with significant physical asset exposure in vulnerable regions.
Capital Expenditure Trajectories
Climate scenarios fundamentally reshape capital allocation. Transition scenarios require accelerated investment in low-carbon technologies, while hot house scenarios demand physical adaptation capex. For capital-intensive sectors, these differences are substantial:
A European utility company's capex profile might show:
- Orderly Transition: €8-10 billion annually through 2035 (versus €5-6 billion baseline), focused on renewable generation, grid modernization, and storage. Capex intensity peaks at 85-95% of EBITDA through 2030, then normalizes to 60-70% by 2035 as the transition completes.
- Disorderly Transition: Lower initial capex (€6-7 billion through 2028) followed by a surge to €12-14 billion annually 2029-2035 as policy mandates accelerate. Higher peak capex intensity (100-110% of EBITDA) creates financing stress and potential equity dilution.
- Hot House World: Continued fossil fuel investments through 2032 (€6-7 billion annually) followed by stranded asset write-downs of €15-20 billion and emergency transition capex of €10-12 billion annually 2033-2040, combined with €2-3 billion in physical adaptation costs.
These divergent capex paths create dramatically different free cash flow profiles and terminal value assumptions, often representing the largest source of valuation variance across scenarios.
03 Discount Rate Adjustments for Climate Risk
Climate risk affects discount rates through both systematic (beta) and unsystematic (company-specific) risk channels. Current academic research and market practice suggest several approaches:
Systematic Risk Premium
Climate risk represents a systematic, non-diversifiable risk factor. Empirical analysis of equity returns 2020-2025 shows that high-carbon-intensity portfolios underperformed low-carbon portfolios by 180-220 basis points annually on a risk-adjusted basis, suggesting a climate risk premium. Leading practitioners now incorporate a climate beta adjustment, typically adding 50-150 basis points to WACC for companies with high transition risk exposure and inadequate adaptation strategies.
Cost of Debt Adjustments
Credit markets have rapidly priced climate risk. Analysis of European corporate bond spreads in 2025-2026 shows that companies in the top quartile of carbon intensity pay 40-80 basis points more than comparable low-carbon peers, controlling for traditional credit metrics. This spread has widened from 15-25 basis points in 2020, reflecting both regulatory pressure and genuine credit risk concerns about stranded assets and transition costs.
Scenario-Specific WACC
Sophisticated valuations now employ scenario-specific discount rates rather than a single WACC. A chemical manufacturer might use:
- Orderly transition: WACC of 7.2% (base 7.5% minus 30 bps for lower uncertainty and successful adaptation)
- Disorderly transition: WACC of 8.5% (base plus 100 bps for execution risk and financing stress during abrupt transition)
- Hot house world: WACC of 9.8% (base plus 230 bps for stranded asset risk, physical disruptions, and regulatory uncertainty)
04 Terminal Value Under Climate Scenarios
Terminal value typically represents 60-80% of DCF value, making climate assumptions in perpetuity calculations critical. Traditional approaches assuming stable growth and returns in perpetuity are incompatible with climate scenario analysis, which envisions fundamentally different end-states.
Best practice approaches include:
Scenario-Specific Terminal Growth Rates: Rather than uniform 2-3% perpetual growth, align terminal growth with scenario economics. Orderly transition scenarios might assume 2.5-3.0% growth (successful adaptation enabling continued value creation), disorderly scenarios 1.5-2.0% (higher ongoing transition costs), and hot house scenarios 0.5-1.5% (persistent physical disruptions and adaptation costs).
Terminal ROIC Adjustments: Climate scenarios affect sustainable returns on invested capital. Companies successfully navigating the transition may achieve terminal ROIC of 10-12% (premium to WACC), while those with stranded assets or high adaptation costs may see terminal ROIC compress to 6-8%, destroying value in perpetuity.
Exit Multiple Approaches: Some practitioners prefer terminal value multiples calibrated to scenario-specific peer trading comparables, particularly for sectors where climate impacts are well-understood. This approach provides market-based validation but requires careful selection of truly comparable companies with similar climate risk profiles.
05 Real-World Application: Case Study Analysis
Case 1: Global Cement Producer
A 2025 valuation of a major European cement manufacturer illustrates the materiality of climate scenario analysis. Cement production is carbon-intensive (0.5-0.6 tCO2e per ton of cement), making the sector highly exposed to transition risk.
Our scenario analysis showed:
- Orderly Transition Valuation: €8.2 billion (assuming successful deployment of carbon capture and storage technology by 2032, reducing emissions intensity by 60%, with capex of €2.5 billion offset by avoided carbon costs and green premium pricing)
- Disorderly Transition Valuation: €5.8 billion (delayed CCS deployment until 2035, higher cumulative carbon costs of €3.2 billion 2025-2035, market share losses to low-carbon alternatives)
- Hot House Valuation: €4.1 billion (continued high-carbon production through 2038, followed by emergency transition costs and stranded asset write-downs of €1.8 billion, plus physical impacts on quarries and logistics from extreme weather)
Probability-weighted valuation: €6.4 billion (assuming 35% orderly, 40% disorderly, 25% hot house), representing a 22% discount to the company's traditional DCF valuation of €8.2 billion that failed to adequately incorporate climate risks.
Case 2: Agricultural Technology Company
Conversely, a 2026 valuation of a precision agriculture technology provider showed climate scenarios creating upside optionality. The company's products enable farmers to optimize water usage, reduce fertilizer application, and adapt to changing growing conditions.
Scenario valuations:
- Orderly Transition: €2.8 billion (steady adoption driven by carbon farming incentives and water scarcity regulations)
- Disorderly Transition: €3.4 billion (accelerated adoption as climate impacts become severe and policy responses create urgent demand for adaptation technologies)
- Hot House World: €4.1 billion (extreme weather and crop failures drive rapid, widespread adoption despite higher costs)
Probability-weighted valuation: €3.4 billion, representing significant upside to traditional valuation approaches that treated climate as a peripheral factor rather than a core value driver.
06 Implementation Challenges and Practical Considerations
Integrating climate scenarios into DCF models presents several practical challenges that valuation professionals must navigate:
Data Availability and Quality
Granular, company-specific climate risk data remains limited, particularly for Scope 3 emissions and physical risk exposure. As of 2026, approximately 65% of S&P 500 companies disclose Scope 1 and 2 emissions, but only 35% provide comprehensive Scope 3 data. Valuators must often rely on sector-level proxies and third-party climate risk assessments, introducing estimation uncertainty.
Scenario Consistency and Coherence
Climate scenarios involve complex interdependencies—carbon prices, energy costs, technological progress, policy responses, and physical impacts must align coherently. Inconsistent assumptions (e.g., high carbon prices without corresponding renewable energy deployment) undermine analysis credibility. Leading practitioners develop detailed scenario narratives documenting key assumptions and their logical relationships.
Time Horizon Extension
Meaningful climate scenario analysis requires extending DCF horizons beyond traditional 5-10 years to 15-30 years, as many climate impacts materialize post-2035. This extension introduces additional forecasting uncertainty but is necessary to capture the full range of climate-related value impacts. Sensitivity analysis around long-term assumptions becomes even more critical.
Stakeholder Communication
Presenting scenario-based valuations to boards, investors, and transaction counterparties requires careful communication. Stakeholders accustomed to point estimates may struggle with probability-weighted ranges. Effective practice includes clear scenario narratives, sensitivity analysis showing key value drivers, and explicit discussion of scenario probability assumptions and their rationale.
07 Regulatory and Market Developments Shaping Practice
The regulatory landscape continues to evolve rapidly, driving standardization of climate scenario analysis in valuation:
The EU's Corporate Sustainability Reporting Directive (CSRD), fully effective for large companies in 2025, requires climate scenario analysis aligned with TCFD recommendations. This mandate creates both a data opportunity (more companies producing scenario analyses) and a compliance imperative (valuations must align with reported scenarios to maintain consistency).
The U.S. Securities and Exchange Commission's climate disclosure rules, implemented in modified form in 2024-2025, require material climate risk disclosure for public companies, including scenario analysis for companies with significant climate exposure. While less prescriptive than EU requirements, these rules are driving convergence in U.S. valuation practice.
The International Sustainability Standards Board (ISSB) standards, adopted by over 30 jurisdictions by early 2026, provide global baseline requirements for climate-related disclosures, including scenario analysis. This standardization facilitates cross-border valuation comparability and reduces information asymmetries.
08 Sector-Specific Considerations
Climate scenario impacts vary dramatically by sector, requiring tailored analytical approaches:
Energy Sector: Faces the most severe transition risk, with potential stranded asset values reaching 40-60% of current book value under aggressive transition scenarios. Valuation requires detailed asset-by-asset analysis of break-even carbon prices and retirement timing. Physical risks are also material, particularly for offshore infrastructure exposed to hurricanes and sea-level rise.
Real Estate: Physical risks dominate, with coastal and flood-prone properties facing 15-35% value declines under hot house scenarios by 2050. Transition risks include building performance standards and embodied carbon regulations affecting development economics. Terminal cap rates must reflect climate-adjusted location risk premiums.
Financial Services: Faces indirect exposure through loan portfolios and investment holdings. Valuation requires assessment of credit losses from borrower climate risks and potential asset value declines in investment portfolios. Regulatory capital requirements increasingly reflect climate risk, affecting ROE assumptions.
Technology: Generally lower direct climate risk but significant exposure through supply chains (particularly semiconductor manufacturing's water intensity) and data center energy consumption. Valuation must assess both transition opportunities (clean tech, climate adaptation solutions) and supply chain vulnerabilities.
09 Integration with Traditional Valuation Approaches
Climate scenario analysis enhances rather than replaces traditional valuation methods. Best practice involves:
Comparable Company Analysis: Adjust peer multiples for relative climate risk positioning. A renewable energy developer trading at 14x EBITDA may not be directly comparable to a coal-fired utility at 6x EBITDA—the multiple differential partially reflects climate risk pricing. Scenario analysis helps quantify appropriate adjustments.
Precedent Transactions: Recent M&A transactions increasingly reflect climate risk in pricing. Analysis of 2024-2025 energy sector transactions shows acquirers paying 25-40% premiums for renewable assets versus fossil fuel assets on a per-MW basis, controlling for age and location. These premiums inform scenario-specific valuation multiples.
Sum-of-the-Parts Valuation: For diversified companies, climate scenarios may affect business units differently, making SOTP approaches particularly valuable. A conglomerate with both fossil fuel and renewable energy assets requires separate scenario analysis for each segment, as correlations between segment values vary by scenario.
10 The Path Forward: Climate-Integrated Valuation as Standard Practice
As we progress through 2026, climate scenario analysis is transitioning from a specialized ESG exercise to a core component of mainstream valuation practice. Several trends are accelerating this shift:
First, data availability continues to improve. Third-party climate risk data providers now offer granular physical risk assessments at the asset level, transition risk scoring incorporating forward-looking policy analysis, and scenario-specific financial impact models. These tools reduce the analytical burden of climate integration.
Second, regulatory requirements are creating a compliance floor. Valuations for regulated transactions, fairness opinions, and financial reporting increasingly require explicit climate scenario analysis to meet professional standards and regulatory expectations.
Third, market participants are demanding climate-adjusted valuations. Institutional investors, particularly in Europe, now routinely request scenario analysis in due diligence. Private equity firms are incorporating climate scenarios into investment committee materials. Lenders are using climate-adjusted valuations to inform credit decisions and covenant structures.
Fourth, professional standards are evolving. The International Valuation Standards Council (IVSC) released updated guidance in 2024 explicitly addressing climate risk in valuation, and professional bodies including the CFA Institute and RICS have incorporated climate scenario analysis into continuing education requirements.
For valuation professionals, the imperative is clear: developing expertise in climate scenario analysis is no longer optional but essential to providing credible, forward-looking valuations that reflect the full range of risks and opportunities facing businesses in a changing climate.
Key Takeaway: Climate scenario analysis represents a fundamental evolution in DCF methodology, requiring extended time horizons, probability-weighted scenarios, and systematic integration of physical and transition risks. Valuations that fail to incorporate these factors risk materially misstating enterprise value, particularly for carbon-intensive sectors where scenario impacts can shift valuations by 30-40%.
11 Conclusion: Tools and Capabilities for Climate-Integrated Valuation
The integration of TCFD climate scenarios into DCF models represents both a technical challenge and a professional opportunity. Valuators who develop robust climate scenario capabilities position themselves as trusted advisors capable of navigating the most significant structural economic shift of the coming decades.
The analytical framework outlined in this article—scenario selection and probability weighting, systematic adjustment of revenues, costs, capex, and discount rates across scenarios, and climate-informed terminal value assumptions—provides a roadmap for rigorous climate-integrated valuation. However, implementation requires significant analytical infrastructure: climate risk databases, scenario modeling tools, and frameworks for translating climate variables into financial impacts.
Professional valuation platforms are evolving to support this analytical complexity. Modern tools like iValuate increasingly incorporate climate scenario functionality, enabling practitioners to efficiently model multiple scenarios, adjust assumptions systematically across forecast periods, and generate probability-weighted valuations. These capabilities allow valuation professionals to focus on judgment and interpretation—determining appropriate scenario probabilities, assessing company-specific adaptation strategies, and communicating results to stakeholders—rather than manual spreadsheet construction.
As climate risk continues to reshape corporate valuations across sectors, the firms and professionals who master climate scenario analysis will differentiate themselves in an increasingly sophisticated market. The question is no longer whether to integrate climate scenarios into DCF models, but how quickly valuation practices can evolve to meet the demands of investors, regulators, and clients who recognize that climate risk is financial risk. Platforms like iValuate provide the analytical infrastructure to make this integration efficient and rigorous, enabling professionals to deliver the forward-looking, climate-informed valuations that modern capital markets demand.