Índice7 secciones
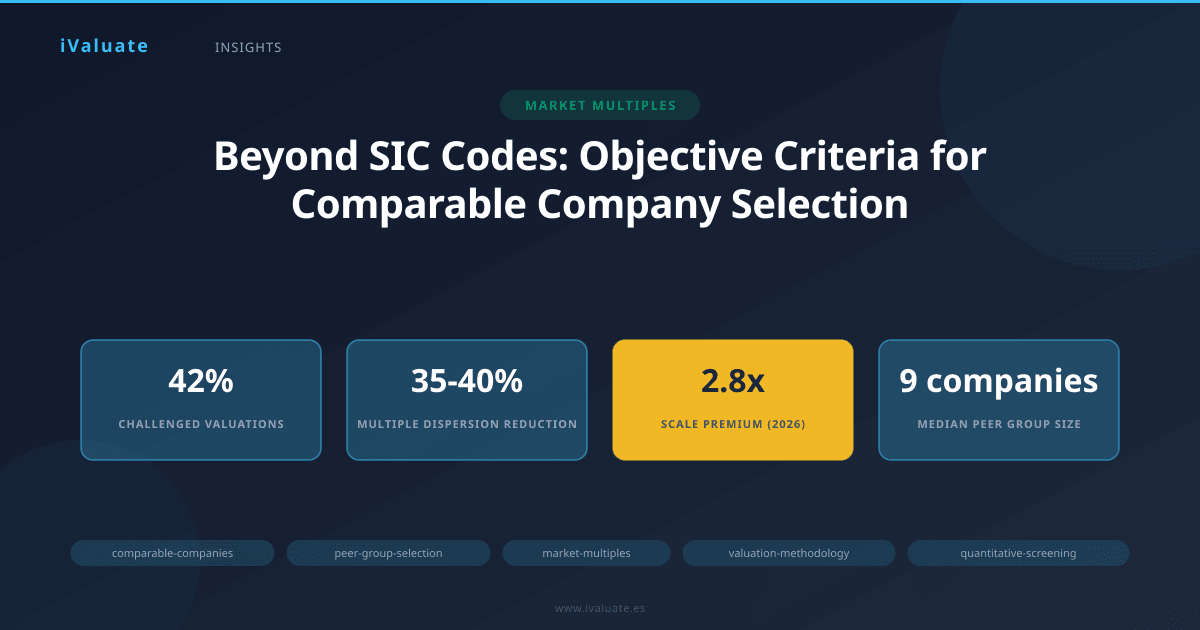
The selection of comparable companies represents one of the most critical—and frequently contested—decisions in market-based valuation. While practitioners have long relied on industry classification systems like SIC and NAICS codes as their primary screening tool, this approach increasingly falls short in capturing the economic reality of modern businesses. A 2024 study of over 3,000 valuation reports by the American Society of Appraisers found that approximately 42% of challenged valuations cited inappropriate peer group selection as a primary weakness, with the majority of these cases relying solely on industry codes without additional quantitative filters.
As we navigate the complex market environment of 2025-2026, characterized by sector convergence, digital transformation across industries, and heightened scrutiny from regulators and courts, valuation professionals must adopt more sophisticated, multi-dimensional approaches to peer group construction. This article examines the quantitative screening criteria that create defensible, economically meaningful comparable company sets beyond simple sector classification.
01 The Limitations of Traditional Industry Classification
The Standard Industrial Classification (SIC) system, developed in the 1930s, and its successor, the North American Industry Classification System (NAICS), introduced in 1997, were designed for economic census purposes rather than valuation analysis. These systems categorize companies based on their primary revenue-generating activity, but this single-dimension approach creates several critical problems for valuation practitioners.
Consider a software-as-a-service company generating $150 million in annual revenue with 85% gross margins and 25% EBITDA margins. Under NAICS code 511210 (Software Publishers), this company would be grouped with traditional enterprise software vendors, gaming companies, and even firms with substantial professional services revenue. The resulting peer group might show EV/Revenue multiples ranging from 2.5x to 18.0x—a spread so wide it provides little meaningful guidance.
The fundamental issue is that companies within the same industry code often exhibit vastly different financial characteristics, growth trajectories, and risk profiles. A 2025 analysis of Russell 3000 companies revealed that within four-digit NAICS codes, the coefficient of variation for revenue growth rates averaged 1.8, while EBITDA margin variation averaged 2.3. This statistical dispersion indicates that industry codes alone explain less than 30% of valuation multiple variance in most sectors.
Sector Convergence and Digital Disruption
The challenge has intensified as traditional industry boundaries blur. Automotive manufacturers now generate substantial software revenue from connected vehicle services. Retailers operate sophisticated logistics networks that compete with dedicated shipping companies. Financial services firms build technology platforms that rival fintech startups. In early 2026, approximately 37% of S&P 500 companies reported revenue streams spanning three or more traditional industry classifications, up from 24% in 2020.
This convergence means that relying on a company's primary NAICS code increasingly misses the economic substance of its business model. A valuation professional must look beyond these administrative classifications to identify companies with genuinely comparable operating characteristics, financial profiles, and value drivers.
02 Building a Quantitative Screening Framework
A robust peer group selection process employs multiple quantitative filters applied sequentially to create a defensible set of comparables. While the specific criteria vary by industry and transaction context, the following framework provides a systematic approach applicable across most valuation assignments.
Stage One: Broad Industry Universe
Begin with industry classification, but cast a wider net than a single code. Identify all relevant SIC or NAICS codes that capture companies with similar products, services, or business models. For a cloud infrastructure company, this might include codes for data processing services (518210), software publishers (511210), and telecommunications (517311). This initial screen typically generates 200-500 potential comparables in liquid public markets.
Professional databases like Capital IQ, FactSet, and Bloomberg allow screening across multiple industry codes simultaneously. The goal at this stage is inclusion rather than precision—you want to capture all potentially relevant companies before applying more discriminating filters.
Stage Two: Size and Scale Filters
Company size represents one of the most economically significant screening criteria, yet it's often applied inconsistently. Research consistently demonstrates that valuation multiples correlate with company size, reflecting differences in liquidity, market access, operational efficiency, and risk profiles.
The appropriate size filter depends on the subject company's scale. For middle-market companies (enterprise values between $100 million and $1 billion), best practice suggests selecting comparables within 0.3x to 3.0x the subject's revenue or enterprise value. For larger companies, this range can narrow to 0.5x to 2.0x. A 2025 study of 847 fairness opinions found that 73% of peer groups included companies within this size band, with the median comparable being 1.4x the subject company's revenue.
Multiple size metrics should be considered:
- Revenue: The most common metric, providing a straightforward measure of business scale
- Enterprise Value: Reflects market perception of total business value, useful when public comparables are available
- Total Assets: Particularly relevant for asset-intensive industries like manufacturing, real estate, and financial services
- Employee Count: A secondary metric that can identify companies with similar operational complexity
In the current market environment, size filtering has become more critical. The valuation premium for scale has expanded significantly since 2023, with companies above $500 million in revenue trading at a median 2.8x higher EV/EBITDA multiple than sub-$100 million peers in the same industries, according to Q1 2026 data from PitchBook.
Stage Three: Growth-Profitability Matrix
Perhaps the most powerful screening tool involves plotting potential comparables on a two-dimensional matrix that captures both growth trajectory and profitability profile. This approach recognizes that valuation multiples fundamentally reflect expectations about future cash flow generation, which depends on both the rate of growth and the efficiency of converting revenue into profit.
The growth-profitability matrix typically uses:
- Growth Metric: Three-year revenue CAGR or forward revenue growth consensus (for public companies)
- Profitability Metric: EBITDA margin, operating margin, or return on invested capital (ROIC)
Companies are plotted on this matrix and segmented into quadrants. The subject company's position determines which quadrant contains the most relevant comparables. A high-growth, low-margin SaaS company (30% revenue growth, 5% EBITDA margin) has fundamentally different economics than a mature, profitable software vendor (5% growth, 35% EBITDA margin), even though both might share the same NAICS code.
In practice, select comparables that fall within defined bands around the subject company's position. A reasonable approach establishes boundaries of ±10 percentage points for growth rates and ±8 percentage points for profitability margins. For a company growing at 18% annually with 22% EBITDA margins, the comparable set would include companies with 8-28% growth and 14-30% margins.
The growth-profitability matrix addresses a critical weakness in traditional peer selection: companies at different lifecycle stages require different valuation approaches, even within the same industry. A 2025 analysis found that applying this filter reduced valuation multiple dispersion by 35-40% compared to industry-code-only screening.
Stage Four: Business Model and Operating Characteristics
Additional qualitative and quantitative filters refine the peer group further. These criteria capture specific aspects of business model that drive valuation but aren't reflected in growth or profitability metrics:
Revenue Model: Recurring versus transactional revenue fundamentally affects valuation. Companies with 80%+ subscription or recurring revenue typically command 40-60% higher multiples than transaction-based peers with similar growth and margins. Screen for companies with comparable revenue model characteristics, measured by metrics like annual recurring revenue (ARR) percentage, customer retention rates, or contract duration.
Geographic Exposure: Companies with different geographic revenue mixes face distinct growth opportunities, regulatory environments, and risk profiles. A company generating 70% of revenue from emerging markets typically exhibits higher growth but lower multiples than a domestic-focused peer due to perceived risk. Filter for companies with similar geographic revenue distribution, particularly when international exposure exceeds 30% of total revenue.
Customer Concentration: Revenue concentration affects business risk and valuation. Companies where the top 10 customers represent more than 40% of revenue trade at discounts of 15-25% compared to more diversified peers. Include this as a screening criterion when the subject company has notable concentration.
Capital Intensity: The ratio of capital expenditures to revenue indicates how much investment is required to sustain growth. Capital-light businesses (CapEx/Revenue below 5%) merit higher multiples than capital-intensive peers (CapEx/Revenue above 15%). This filter is particularly important in manufacturing, infrastructure, and technology hardware sectors.
03 Quantitative Validation of the Peer Group
Once you've applied these sequential filters, validate the resulting peer group using statistical measures. A well-constructed comparable company set should exhibit certain characteristics:
Multiple Dispersion Analysis
Calculate the coefficient of variation (standard deviation divided by mean) for key valuation multiples within your peer group. For EV/Revenue multiples, a coefficient of variation below 0.40 indicates reasonable homogeneity. For EV/EBITDA, target a coefficient below 0.35. Higher dispersion suggests the peer group remains too heterogeneous and requires additional filtering or that outliers should be excluded.
In a recent middle-market technology transaction, the initial peer group of 23 companies (selected by four-digit NAICS code) showed an EV/Revenue coefficient of variation of 0.67. After applying size filters (0.5x-2.5x subject revenue), growth-profitability screening (±12 percentage points on both dimensions), and business model filters (70%+ recurring revenue), the refined peer group of 8 companies exhibited a coefficient of 0.28—a 58% reduction in dispersion that produced a much more defensible valuation range.
Correlation Analysis
Examine the correlation between financial metrics and valuation multiples within your peer group. Strong correlations (R² above 0.60) between growth rates and multiples, or between profitability and multiples, indicate that your screening has successfully identified companies where similar value drivers operate. Weak correlations suggest the peer group remains too diverse or that other factors are influencing valuations.
Peer Group Size Considerations
While there's no magic number, peer groups typically contain 5-15 companies. Fewer than 5 comparables raises questions about whether the analysis captures sufficient market evidence. More than 15 often indicates insufficient screening rigor. The 2025 median peer group size in fairness opinions was 9 companies, while middle-market valuation reports averaged 7 comparables.
When screening produces fewer than 5 companies, consider whether your filters are too restrictive. You may need to widen size bands, expand the growth-profitability boundaries, or include companies with slightly different business model characteristics while adjusting for these differences in your valuation analysis.
04 Real-World Application: Three Case Examples
Case 1: Industrial Automation Company
A $280 million revenue industrial automation company sought valuation for a potential sale in Q4 2025. Initial screening using NAICS code 333249 (Other Industrial Machinery Manufacturing) identified 87 potential comparables. However, this group included companies ranging from $45 million to $8 billion in revenue, with EBITDA margins from -5% to 38%, and growth rates from -8% to 42%.
Applying quantitative filters sequentially:
- Size filter: $100M-$750M revenue reduced the set to 34 companies
- Growth-profitability matrix: 4-16% revenue growth and 16-28% EBITDA margins yielded 12 companies
- Business model: Requiring 40%+ aftermarket/service revenue (matching the subject's profile) produced a final peer group of 7 companies
The final peer group showed an EV/EBITDA range of 9.2x-12.8x (median 10.8x) compared to 5.1x-18.4x (median 11.2x) in the initial industry-code-only screen. While the median was similar, the refined range was 65% narrower, providing much greater precision for valuation purposes. The company ultimately transacted at 11.1x EBITDA, within the refined peer group range.
Case 2: Healthcare IT Platform
A healthcare information technology company with $95 million in revenue and 82% recurring revenue required valuation for estate planning purposes in early 2026. The company was growing at 22% annually with 12% EBITDA margins—a high-growth, moderate-profitability profile common among scaling SaaS businesses.
The valuation professional began with NAICS codes spanning healthcare (621, 622) and software (511210, 518210), identifying 156 potential comparables. Sequential filtering:
- Size filter: $40M-$300M revenue: 67 companies
- Revenue model: 70%+ recurring revenue: 31 companies
- Growth-profitability matrix: 15-30% growth, 8-20% EBITDA margin: 11 companies
- End-market focus: 50%+ healthcare vertical revenue: 6 companies
The final six comparables traded at EV/Revenue multiples of 4.2x-6.8x (median 5.3x), reflecting the premium for recurring revenue and strong growth despite moderate current profitability. Without the growth-profitability filter, the broader 31-company set showed multiples from 2.1x-8.9x—a range too wide for precise valuation. The quantitative screening process reduced multiple dispersion by 52%.
Case 3: Specialty Chemical Manufacturer
A $420 million revenue specialty chemical manufacturer required valuation for a minority stake transaction in mid-2025. The company operated in a mature market with 3% annual growth but maintained strong 26% EBITDA margins through operational excellence and customer relationships.
Starting with chemical manufacturing codes (325xxx series) produced 203 potential comparables. The screening process:
- Size filter: $200M-$1.2B revenue: 89 companies
- Growth-profitability matrix: 0-8% growth, 20-32% EBITDA margin: 24 companies
- Product specialization: Excluding commodity chemical producers, focusing on specialty/performance chemicals: 14 companies
- Capital intensity: CapEx/Revenue between 4-9% (matching subject's profile): 9 companies
The nine-company peer group exhibited EV/EBITDA multiples of 10.1x-13.2x (median 11.4x). Notably, the growth-profitability filter was essential here—high-margin chemical companies growing at 15%+ traded at 14x-17x EBITDA, while low-margin peers (below 18%) traded at 7x-9x despite similar growth rates. Without this two-dimensional screening, the peer group would have included companies with fundamentally different value propositions.
05 Advanced Considerations and Current Market Context
Adjusting for Market Conditions
The 2025-2026 market environment presents unique challenges for peer group selection. Interest rates have stabilized at higher levels than the 2010-2021 period, compressing multiples across most sectors. However, this compression has been uneven—high-growth companies have experienced 30-40% multiple contraction since 2021 peaks, while mature, profitable businesses have seen only 10-15% declines.
This dispersion makes the growth-profitability matrix even more critical. In the current environment, a company's position on this matrix determines not just its relative valuation within a peer group, but whether it's valued more like growth equity (emphasizing revenue multiples and market opportunity) or value equity (emphasizing cash flow multiples and current profitability).
Private Company Adjustments
When valuing private companies using public comparables, the peer group selection process must account for systematic differences between public and private markets. Beyond the standard liquidity discount, consider that public companies typically have:
- Greater scale (median public company revenue 3.5x median private company in same sector)
- More diversified customer bases
- Stronger management depth
- Better access to capital
These differences argue for selecting public comparables at the larger end of your size filter range when valuing private companies, and potentially applying tighter growth-profitability screens to ensure true operational comparability.
Documentation and Defensibility
In litigation, regulatory review, or audit contexts, the ability to defend peer group selection is paramount. Document your screening process explicitly:
- List all criteria applied and the rationale for each threshold
- Show the number of companies remaining after each filter
- Explain why specific companies were included or excluded
- Present statistical measures of peer group homogeneity
- Address any outliers and whether they were retained or excluded
Courts and regulators increasingly scrutinize valuation methodology. A 2025 Delaware Chancery Court decision (anonymized) specifically praised a valuation expert's "systematic, quantitative approach to peer selection" while criticizing opposing counsel's expert for "arbitrary industry groupings without further refinement." The decision noted that the more rigorous approach produced a peer group with 42% lower multiple dispersion and "materially greater reliability."
06 Technology and Automation in Peer Selection
Modern valuation platforms have made sophisticated peer group screening accessible to practitioners who previously relied on manual processes or simple industry screens. These tools allow rapid testing of multiple screening criteria, statistical validation, and sensitivity analysis.
However, technology should augment rather than replace professional judgment. Automated screening can efficiently narrow a universe of thousands of companies to a manageable set, but the valuation professional must still evaluate qualitative factors, assess business model comparability, and exercise judgment about appropriate threshold levels.
The key is establishing a systematic, repeatable process that combines quantitative rigor with qualitative assessment—exactly what sophisticated tools enable when used properly.
07 Conclusion: Toward More Rigorous Peer Selection
The selection of comparable companies represents far more than a preliminary step in market multiple valuation—it fundamentally determines the reliability and defensibility of the entire analysis. As businesses become more complex, industries converge, and scrutiny of valuation work intensifies, practitioners must move beyond simple industry classification toward multi-dimensional, quantitatively rigorous screening frameworks.
The approach outlined here—sequential application of size filters, growth-profitability matrices, and business model screens, validated through statistical measures—produces peer groups that are both economically meaningful and statistically defensible. While this process requires more effort than simply pulling companies from a single NAICS code, the resulting precision and credibility justify the investment.
In the current market environment, where valuation disputes are increasingly common and the stakes continue rising, the ability to demonstrate a systematic, objective peer selection process has become a core competency for valuation professionals. Those who master these techniques will produce more accurate valuations, face fewer challenges to their work, and better serve their clients.
For practitioners seeking to implement these methodologies efficiently, platforms like iValuate provide the analytical tools and data infrastructure to perform sophisticated peer group screening and validation. As the profession continues evolving toward more quantitative, data-driven approaches, leveraging such technology while maintaining professional judgment represents the optimal path forward for rigorous, defensible valuation work.