Índice8 secciones
Valuing banks and financial institutions requires a fundamentally different approach than traditional corporate valuation. Unlike industrial companies where discounted cash flow (DCF) models reign supreme, financial institutions demand specialized methodologies that account for regulatory capital requirements, the unique nature of financial leverage, and the central role of equity capital management. As we navigate the 2025-2026 environment—characterized by elevated interest rates, evolving Basel III endgame rules, and persistent inflation concerns—understanding these valuation frameworks has never been more critical.
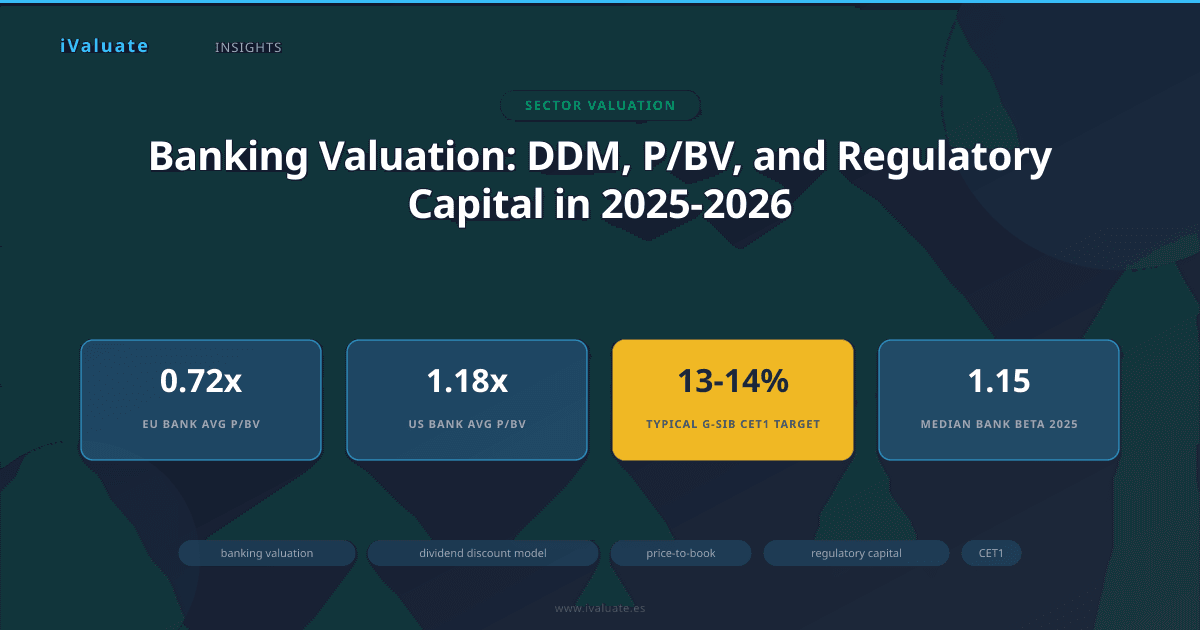
The global banking sector has experienced significant repricing over the past 24 months. European banks trade at an average price-to-book (P/BV) ratio of 0.72x as of Q1 2025, while their U.S. counterparts command 1.18x, reflecting divergent profitability profiles and regulatory environments. This article explores the three pillars of banking valuation: dividend discount models (DDM), price-to-book multiples anchored in the ROE-COE framework, and the critical overlay of regulatory capital considerations including Common Equity Tier 1 (CET1) ratios and Supervisory Review and Evaluation Process (SREP) outcomes.
01 Why Traditional DCF Falls Short for Banks
Before diving into banking-specific methodologies, it's essential to understand why conventional DCF analysis proves problematic for financial institutions. The challenge stems from three fundamental characteristics:
- Debt is raw material, not capital structure: For banks, deposits and wholesale funding aren't financing decisions—they're the inventory that generates revenue through net interest margin (NIM). Attempting to calculate unlevered free cash flow becomes conceptually meaningless.
- Working capital is the business: The loan book, securities portfolio, and deposit base constitute the core business operations, making traditional working capital adjustments inapplicable.
- Regulatory capital, not economic capital, drives decisions: Banks operate under binding regulatory constraints that dictate minimum capital ratios, dividend capacity, and growth potential—factors external to pure economic value creation.
These realities necessitate valuation approaches that treat equity capital as the scarce resource being deployed and focus on returns generated on that capital base.
02 Dividend Discount Models: The Theoretical Foundation
The dividend discount model represents the most theoretically sound approach to banking valuation. At its core, DDM recognizes that a bank's value to shareholders equals the present value of all future dividends and distributions. For financial institutions—which face regulatory restrictions on capital deployment and typically maintain high payout ratios—this framework aligns closely with economic reality.
Single-Stage DDM for Mature Banks
For stable, mature banks with predictable dividend policies, the Gordon Growth Model provides a straightforward valuation:
Value = D₁ / (COE - g)
Where D₁ represents next year's expected dividend, COE is the cost of equity, and g is the perpetual growth rate. Consider a European universal bank with the following characteristics as of March 2025:
- Current dividend: €2.40 per share
- Expected dividend growth: 3.5% annually
- Cost of equity: 9.2% (derived from CAPM with current risk-free rate of 3.1% and equity risk premium of 6.5%)
The implied value would be: €2.48 / (0.092 - 0.035) = €43.51 per share. If the bank trades at €38, this suggests a 14.5% upside, though sensitivity to the growth assumption is substantial.
Multi-Stage DDM for Growth-Oriented Institutions
For banks undergoing transformation—whether through digital expansion, geographic growth, or business model shifts—a multi-stage approach captures changing return profiles. Regional banks in the U.S. Southeast, for example, have demonstrated 8-12% loan growth in 2024-2025 as population migration continues, justifying a two-stage model with elevated near-term growth.
The framework typically involves:
- Stage 1 (Years 1-5): Explicit forecast of earnings, payout ratios, and dividends based on business plan assumptions and regulatory capital trajectories
- Stage 2 (Years 6+): Terminal value calculation using Gordon Growth Model with normalized payout ratio (typically 50-70% for banks) and sustainable growth rate
A critical consideration in 2025-2026 is the dividend capacity constrained by regulatory capital requirements. Banks must maintain CET1 ratios above regulatory minimums plus buffers, directly limiting distributable earnings.
Linking Dividends to Regulatory Capital
The sustainable dividend growth rate for a bank cannot exceed:
g = ROE × (1 - Payout Ratio)
However, this must be reconciled with regulatory capital accumulation requirements. If a bank targets a 13% CET1 ratio (versus a 10.5% requirement including buffers) and generates 12% ROE, the maximum sustainable payout ratio becomes constrained by the need to build capital as the balance sheet grows.
A bank generating 11% ROE with a 60% payout ratio can theoretically grow dividends at 4.4% annually, but if risk-weighted assets are expanding 6% per year, capital adequacy will deteriorate unless the payout ratio is reduced or ROE increases. This dynamic has been particularly visible among European banks rebuilding capital buffers in 2024-2025.
03 Price-to-Book Valuation: The Practitioner's Standard
While DDM provides theoretical rigor, price-to-book (P/BV) multiples dominate practical banking valuation. This preference stems from the tangible nature of bank equity capital, the regulatory focus on book value measures, and the direct relationship between P/BV and value creation through the ROE-COE framework.
The ROE-COE Relationship
The fundamental insight linking P/BV to value creation is elegant: a bank should trade at a premium to book value (P/BV > 1.0x) only when it generates returns on equity exceeding its cost of equity. The theoretical relationship, derived from the Gordon Growth Model, is:
P/BV = (ROE - g) / (COE - g)
Or in simplified form when growth equals the risk-free rate:
P/BV ≈ ROE / COE
This framework immediately explains observed market patterns. U.S. money center banks trading at 1.3-1.5x book in early 2025 generate ROEs of 12-14% against costs of equity around 9-10%. Conversely, European banks at 0.6-0.8x book produce ROEs of 7-9% against similar COE levels, reflecting persistent value destruction or market skepticism about sustainability.
Practical Application: Comparable Company Analysis
When conducting P/BV-based comparable company analysis, rigorous practitioners adjust for several factors:
- ROE normalization: Strip out one-time items, litigation charges, and restructuring costs to arrive at sustainable ROE. For 2025 analysis, this includes normalizing for elevated net interest margins that may compress as rate cuts materialize.
- Asset quality: Banks with NPL ratios above peer averages (>2% for European banks, >0.8% for U.S. regionals in 2025) warrant P/BV discounts of 10-25% depending on coverage ratios and workout prospects.
- Business mix: Fee-based businesses (wealth management, transaction banking) command premium valuations due to lower capital intensity and earnings stability. A bank deriving 45% of revenue from fees might trade 0.2-0.3x book value higher than a pure lending institution with identical ROE.
- Regulatory positioning: CET1 ratios significantly above requirements provide strategic flexibility and support premium valuations, as discussed below.
Case Study: Regional Bank Consolidation
Consider a 2024 acquisition in the U.S. regional banking space where a $45 billion asset acquirer purchased a $12 billion target. The target traded at 1.15x tangible book value despite generating only 9.2% ROTCE (return on tangible common equity), below its estimated 10% cost of equity. The premium was justified by:
- Significant cost synergies (32% of target's cost base, achievable over 18 months)
- Revenue synergies from cross-selling treasury management services (estimated 8% revenue uplift)
- Combined ROE projection of 13.5% post-integration
The acquirer paid 1.35x tangible book, implying a pro-forma P/TBV of 1.28x for the combined entity—justified by the enhanced ROE-COE spread. This transaction exemplifies how P/BV analysis must incorporate forward-looking profitability assessments rather than backward-looking multiples alone.
04 Regulatory Capital: The Binding Constraint
No banking valuation in 2025-2026 can ignore regulatory capital dynamics. The Basel III framework, now in its endgame phase with final implementation deadlines approaching, establishes minimum capital requirements that fundamentally constrain value creation and distribution capacity.
Common Equity Tier 1 (CET1): The Gold Standard
CET1 capital—comprising common shares, retained earnings, and other comprehensive income, minus regulatory deductions—represents the highest quality loss-absorbing capital. As of 2025, regulatory minimums typically include:
- Minimum CET1 ratio: 4.5% of risk-weighted assets (RWA)
- Capital conservation buffer: 2.5%
- Countercyclical buffer: 0-2.5% (varies by jurisdiction and economic conditions)
- G-SIB or O-SIB surcharge: 1-3.5% for systemically important institutions
For a global systemically important bank (G-SIB), the total CET1 requirement might reach 12-13%, with most institutions targeting 13-14% to maintain comfortable buffers. Each percentage point of CET1 ratio represents substantial capital: for a bank with €800 billion in RWA, a 1% increase requires €8 billion in additional equity capital.
Impact on Valuation Multiples
Empirical analysis of European and U.S. banks in Q1 2025 reveals a strong positive correlation between CET1 ratios and P/BV multiples, even after controlling for ROE. Banks operating with CET1 ratios 200-300 basis points above regulatory requirements trade at 0.15-0.25x higher P/BV multiples, reflecting:
- Distribution capacity: Excess capital enables higher dividends and share buybacks without compromising regulatory standing
- Strategic flexibility: Ability to pursue acquisitions, organic growth, or business investments without capital constraints
- Stress resilience: Greater capacity to absorb losses during economic downturns without breaching regulatory minimums
Conversely, banks operating near minimum requirements face valuation discounts of 20-35%, as any adverse development (asset quality deterioration, litigation, operational losses) could trigger regulatory intervention and forced capital raising at dilutive terms.
The SREP Process and Pillar 2 Requirements
The Supervisory Review and Evaluation Process (SREP) represents the European Central Bank's comprehensive assessment of each significant institution's risk profile, governance, and capital adequacy. Following the annual SREP cycle, banks receive individual capital guidance including Pillar 2 Requirements (P2R) and Pillar 2 Guidance (P2G).
These bank-specific add-ons reflect supervisory concerns about:
- Credit risk concentrations (geographic, sectoral, or single-name)
- Interest rate risk in the banking book (particularly relevant in 2025's volatile rate environment)
- Operational risk and control deficiencies
- Business model sustainability and profitability challenges
A bank receiving elevated P2R of 3% (versus peer average of 1.8%) faces both higher capital requirements and a negative signal about supervisory confidence. This typically translates to a 0.1-0.2x P/BV discount versus peers with standard requirements.
In the 2024 SREP cycle, approximately 23% of significant European institutions received increased capital requirements, primarily driven by concerns about commercial real estate exposures and operational resilience. These decisions directly impacted valuations, with affected banks underperforming peers by 12-18% in the subsequent six months.
05 Integrating the Frameworks: A Holistic Approach
Sophisticated banking valuations don't rely on a single methodology but rather triangulate across multiple approaches, with regulatory capital considerations providing essential context.
The Valuation Cascade
A comprehensive banking valuation in 2025-2026 typically follows this sequence:
Step 1: Regulatory Capital Assessment
Begin by modeling the bank's capital position over a 3-5 year horizon, incorporating:
- Baseline earnings projections (conservative, base, optimistic cases)
- RWA growth assumptions tied to balance sheet expansion and regulatory changes
- Planned distributions (dividends and buybacks)
- Regulatory requirements including buffers and SREP outcomes
This analysis establishes the feasible range of payout ratios and growth rates—critical inputs for both DDM and P/BV approaches.
Step 2: Dividend Discount Model
Using the capital-constrained payout ratios from Step 1, build a multi-stage DDM incorporating:
- Explicit 5-year dividend forecasts
- Terminal value based on sustainable payout ratio (typically converging to 60-70%)
- Cost of equity derived from CAPM, with beta estimates reflecting current market conditions (median bank beta of 1.15 in 2025)
Step 3: Price-to-Book Analysis
Develop P/BV estimates through two lenses:
- Theoretical P/BV: Using the ROE/COE framework with forward-looking ROE estimates (2026-2027 normalized earnings)
- Relative P/BV: Benchmarking against comparable institutions with adjustments for ROE differential, asset quality, business mix, and regulatory positioning
Step 4: Reconciliation and Synthesis
Compare the valuations derived from DDM and P/BV approaches. Significant divergence (>15%) warrants investigation:
- Are growth assumptions consistent across methodologies?
- Does the P/BV multiple properly reflect sustainable ROE versus current elevated/depressed levels?
- Are regulatory capital constraints adequately captured in dividend projections?
Real-World Example: Mid-Tier European Bank
Consider a €180 billion asset European bank with the following characteristics as of March 2025:
- CET1 ratio: 14.2% (requirement: 11.8% including buffers and P2R)
- ROE: 8.4% (2024 actual), projected 9.2% (2025-2027 average)
- Cost of equity: 9.5%
- Current P/BV: 0.68x
- Book value per share: €42
The DDM approach, assuming 55% payout ratio and 2.8% perpetual growth, yields a value of €31.50 per share (€42 × 0.75x P/BV), suggesting the current 0.68x multiple is roughly fair given the ROE-COE relationship.
However, deeper analysis reveals the bank is targeting 10.5% ROE by 2027 through digital transformation and cost reduction (€450 million program). If achievable, the theoretical P/BV rises to 0.88x, implying €37 per share—an 18% upside from current levels.
The investment decision hinges on conviction in the transformation program and assessment of execution risk. The excess capital position (240 bps above requirements) provides a margin of safety and supports enhanced distributions if ROE targets prove elusive.
06 Special Considerations for 2025-2026
Several factors specific to the current environment warrant particular attention in banking valuations:
Net Interest Margin Normalization
The 2022-2024 rate hiking cycle drove NIMs to multi-year highs, with U.S. regional banks averaging 3.45% in Q4 2024 versus 2.95% in 2021. As central banks pivot to rate cuts (Fed funds rate projected at 3.75-4.00% by end-2025), NIM compression represents a significant headwind. Valuations must reflect normalized NIM assumptions—typically 20-35 bps below current levels—rather than extrapolating recent profitability.
Commercial Real Estate Exposures
Office property valuations remain under pressure, with vacancy rates in major markets reaching 18-22% and refinancing challenges mounting. Banks with CRE concentrations above 300% of capital face heightened scrutiny and potential valuation discounts of 15-25%. Stress testing these portfolios under adverse scenarios (30-40% value declines in office, 15-20% in retail) is essential for prudent valuation.
Basel III Endgame Implementation
The final Basel III reforms, implementing the output floor and revised standardized approaches, will increase RWAs for many banks by 5-15% when fully phased in by 2028. This mechanically reduces capital ratios and may constrain distribution capacity. Forward-looking valuations must incorporate these regulatory changes, particularly for banks currently operating with modest capital buffers.
07 Practical Tools and Workflow
Executing rigorous banking valuations requires specialized analytical capabilities. Professional-grade platforms have emerged to streamline the process, integrating regulatory capital modeling, DDM calculations, and comparable company analysis in unified workflows.
Leading practitioners typically maintain proprietary models with the following components:
- Dynamic capital planning modules that stress-test CET1 ratios under multiple scenarios
- Peer benchmarking databases with granular business segment and geographic breakdowns
- Sensitivity tables showing valuation implications of ROE, COE, and growth rate variations
- Regulatory requirement trackers updated for SREP outcomes and buffer changes
The complexity of these analyses—particularly when valuing portfolios of financial institutions or conducting relative value assessments across regions—makes efficient tooling essential. Platforms like iValuate enable professionals to rapidly model multiple scenarios, benchmark against comprehensive peer sets, and generate institutional-quality valuation reports that withstand board-level and investor scrutiny.
08 Conclusion: Mastering the Discipline
Banking valuation represents one of the most intellectually demanding areas of corporate finance, requiring fluency in dividend discount theory, relative valuation frameworks, and the intricate world of regulatory capital management. As we navigate 2025-2026, with interest rate uncertainty, evolving regulatory requirements, and persistent asset quality concerns, the margin for error has narrowed considerably.
The most successful practitioners recognize that no single methodology suffices. Dividend discount models provide theoretical anchoring but require careful calibration of growth assumptions and payout ratios constrained by regulatory capital dynamics. Price-to-book multiples offer practical benchmarking but demand rigorous adjustment for ROE sustainability, business mix, and regulatory positioning. And throughout, the overlay of CET1 requirements, SREP outcomes, and Basel III implementation timelines provides the binding constraints within which value creation occurs.
For CFOs contemplating strategic alternatives, M&A advisors structuring transactions, private equity professionals evaluating financial services investments, or business owners seeking to understand their institution's value, mastering these frameworks is non-negotiable. The banks that trade at premium valuations in today's market share common characteristics: ROEs sustainably above cost of equity, robust capital positions providing strategic flexibility, and business models resilient to the structural changes reshaping financial services.
As regulatory complexity increases and market volatility persists, the analytical infrastructure supporting these valuations becomes increasingly critical. Whether building proprietary models or leveraging specialized platforms like iValuate, the ability to rapidly stress-test assumptions, benchmark against evolving peer groups, and synthesize multiple valuation perspectives separates sophisticated analysis from superficial multiples-based guesswork. In an industry where capital allocation decisions involve billions and regulatory missteps carry existential consequences, precision in valuation isn't merely academic—it's imperative.