Índice9 secciones
Valuing banks and financial institutions requires a fundamentally different approach than traditional corporate valuation. The unique capital structure, regulatory framework, and business model of financial institutions render standard DCF methodologies problematic. As we navigate the complex regulatory landscape of 2025-2026, with Basel III fully implemented and evolving supervisory expectations, understanding specialized valuation techniques has never been more critical for M&A advisors, equity analysts, and institutional investors.
This article provides a comprehensive examination of the three pillars of bank valuation: dividend discount models (DDM), price-to-book value (P/BV) multiples, and the critical regulatory capital considerations that underpin both approaches. We'll explore how Common Equity Tier 1 (CET1) ratios, Supervisory Review and Evaluation Process (SREP) requirements, and the ROE-COE spread drive valuation outcomes in today's market.
01 Why Traditional Valuation Methods Fall Short for Banks
Before diving into specialized methodologies, it's essential to understand why standard enterprise value-based approaches prove inadequate for financial institutions. Banks operate with fundamentally different economics than industrial or service companies:
- Debt is inventory, not financing: A bank's liabilities—primarily customer deposits—represent its raw material for generating revenue through lending and investment activities. The traditional concept of enterprise value, which adds back debt, becomes meaningless.
- Regulatory capital constraints: Banks cannot freely deploy capital. Minimum capital ratios, buffer requirements, and supervisory expectations create hard constraints on growth and distributions.
- Asset opacity: The quality and true economic value of loan portfolios, trading books, and complex financial instruments often differ materially from book values, particularly during stress periods.
- Earnings volatility: Credit cycles, trading income fluctuations, and fair value adjustments create earnings patterns that complicate traditional DCF projections.
These characteristics necessitate valuation frameworks that explicitly account for regulatory capital dynamics and focus on equity value rather than enterprise value. The three dominant approaches—DDM, P/BV multiples, and residual income models—have emerged as industry standards precisely because they address these unique features.
02 Dividend Discount Models: The Theoretical Foundation
The dividend discount model represents the most theoretically sound approach to bank valuation, grounded in the fundamental principle that equity value equals the present value of all future cash flows to shareholders. For banks, where regulatory constraints and capital requirements heavily influence distribution capacity, dividends (including share buybacks) represent the primary mechanism for returning value to shareholders.
The Gordon Growth Model for Stable Banks
For mature, stable financial institutions with predictable dividend policies, the Gordon Growth Model provides an elegant valuation framework:
Value = D₁ / (r - g)
Where D₁ represents the expected dividend in the next period, r is the cost of equity, and g is the perpetual growth rate. As of Q1 2026, major European banks trade at implied cost of equity rates ranging from 8.5% to 11.2%, depending on their risk profiles and geographic exposures.
Consider a practical example: A well-capitalized European universal bank with a current dividend of €2.50 per share, expected to grow at 3.5% annually (roughly in line with nominal GDP growth), and a cost of equity of 9.5%. The implied value would be:
Value = (€2.50 × 1.035) / (0.095 - 0.035) = €43.13 per share
However, the model's simplicity masks critical assumptions. The perpetual growth rate must remain below the cost of equity and should reflect realistic long-term economic growth expectations. In the current environment, with European GDP growth forecasts of 1.8-2.2% and inflation targets around 2%, sustainable dividend growth rates typically range from 3% to 4.5% for established institutions.
Multi-Stage DDM for Growth-Oriented Institutions
For banks undergoing transformation, pursuing aggressive growth strategies, or recovering from restructuring, multi-stage models provide greater flexibility. These models typically employ a three-stage framework:
- Stage 1 (Years 1-5): Explicit dividend forecasts based on detailed financial projections, capital plans, and regulatory requirements
- Stage 2 (Years 6-10): Transition period where dividend growth gradually normalizes toward long-term sustainable rates
- Stage 3 (Year 11+): Terminal value calculation using the Gordon Growth Model
A mid-sized Spanish bank executing a digital transformation strategy might project 8% dividend growth for the first five years as efficiency improvements flow through to profitability, 5% growth during the transition period, and 3.5% perpetual growth thereafter. With a 10% cost of equity, this produces a materially different valuation than a simple single-stage model.
The critical insight: DDM valuation is fundamentally a story about sustainable capital generation and distribution capacity, constrained by regulatory requirements and business model economics.
03 Price-to-Book Value: The Market Standard
While DDM provides theoretical rigor, price-to-book value (P/BV) multiples dominate practical bank valuation for good reason. Book value—specifically tangible book value—represents the regulatory capital base that drives a bank's earning capacity and risk-bearing ability. The P/BV multiple effectively captures the market's assessment of a bank's ability to generate returns above its cost of equity.
Understanding the P/BV Framework
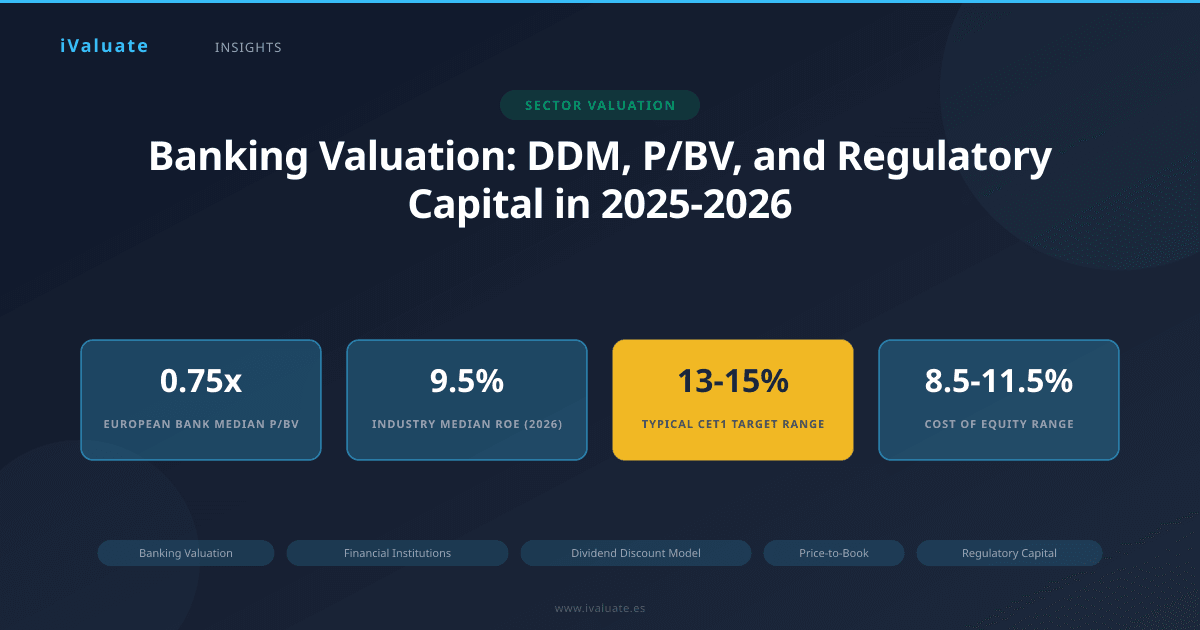
As of early 2026, European banks trade at P/BV multiples ranging from 0.4x to 1.8x, with a median around 0.75x. This wide dispersion reflects fundamental differences in profitability, asset quality, and growth prospects. The theoretical relationship between P/BV and fundamentals is expressed through the ROE-COE framework:
P/BV = (ROE - g) / (COE - g)
Or more intuitively: P/BV = ROE / COE (assuming sustainable growth equals retention rate times ROE)
This elegant formula reveals why P/BV multiples vary so dramatically. A bank generating 12% ROE with a 9% cost of equity should theoretically trade at 1.33x book value. Conversely, a bank earning 7% ROE against a 10% cost of equity should trade at 0.70x book—below tangible book value, implying value destruction.
Real-World P/BV Analysis: Three Case Studies
Case 1: The Premium Franchise — A leading Nordic bank trades at 1.6x P/BV in Q1 2026, justified by consistent 14-15% ROE, a strong CET1 ratio of 18.5%, and dominant market positions in wealth management and corporate banking. The bank's digital infrastructure and low-cost deposit franchise support sustainable returns well above its estimated 9.5% cost of equity.
Case 2: The Turnaround Story — An Italian bank trades at 0.55x P/BV despite recent profitability improvements. The discount reflects legacy NPL concerns (gross NPL ratio of 4.2%, down from 12% in 2020), uncertainty about net interest margin sustainability as ECB rates stabilize, and a modest CET1 ratio of 13.2% that limits distribution capacity. However, improving ROE (currently 8%, targeting 10% by 2027) suggests potential multiple expansion.
Case 3: The Challenged Model — A German regional bank trades at 0.45x P/BV, reflecting structural profitability challenges. With ROE of 6.5% against an estimated 9.5% cost of equity, the bank destroys value. Low interest rate legacy, high cost-to-income ratio (72%), and limited scale in an increasingly digital market explain the deep discount.
Adjustments to Book Value
Sophisticated analysts adjust reported book value for several factors:
- Intangible assets: Goodwill and other intangibles are typically excluded, focusing on tangible book value (TBV)
- Unrealized gains/losses: Securities portfolios marked through OCI may require adjustment based on market conditions
- Loan loss reserve adequacy: Comparison of coverage ratios to peers and historical loss experience
- Pension obligations: Underfunded pension plans represent hidden liabilities
- Litigation and conduct risk: Potential settlements and fines not fully reserved
These adjustments can materially impact valuation. A bank with €10 billion in reported equity might have tangible book value of €8.5 billion after removing €1.2 billion in goodwill and adjusting for €300 million in estimated reserve shortfalls.
04 The ROE-COE Spread: The Value Creation Metric
The relationship between return on equity (ROE) and cost of equity (COE) represents the single most important driver of bank valuations. This spread determines whether a bank creates or destroys shareholder value and directly influences both P/BV multiples and DDM valuations.
Calculating Cost of Equity for Banks
Most practitioners employ the Capital Asset Pricing Model (CAPM) to estimate cost of equity:
COE = Risk-free rate + Beta × Equity risk premium
As of Q1 2026, typical inputs for European banks include:
- Risk-free rate: 2.8-3.2% (10-year government bonds for core European countries)
- Equity risk premium: 6.0-6.5% (based on historical and forward-looking analyses)
- Beta: 0.9-1.4 (varying by bank size, business mix, and geographic exposure)
This yields cost of equity estimates ranging from 8.5% to 11.5% for most institutions. However, banks with elevated risk profiles—significant emerging market exposure, concentrated loan books, or weak capital positions—may face cost of equity above 12%.
Achieving Sustainable ROE in the Current Environment
The challenge for European banks in 2025-2026 is generating ROE that exceeds cost of equity. Industry median ROE has improved to approximately 9.5%, up from 7% in 2023, driven by:
- Higher interest rates improving net interest margins (NIMs averaging 1.85-2.10% vs. 1.20-1.40% in the negative rate environment)
- Cost reduction programs delivering efficiency improvements (cost-to-income ratios declining toward 55-60%)
- Normalization of credit costs as pandemic-era provisions reverse
- Fee income growth from wealth management and transaction services
However, significant dispersion exists. Top-quartile banks achieve 13-15% ROE through superior business models, while bottom-quartile institutions struggle to reach 7%. The key differentiators include:
- Diversified revenue streams: Banks with 40%+ non-interest income show more stable profitability
- Digital maturity: Cost-to-income ratios 10-15 percentage points lower for digital leaders
- Capital efficiency: Risk-weighted asset (RWA) optimization through advanced internal models
- Pricing power: Strong franchises maintain deposit margins even as rates rise
The fundamental valuation question: Can management sustain ROE above COE through the credit cycle? Banks that consistently achieve this trade at premiums to book value; those that cannot trade at discounts.
05 Regulatory Capital: The Binding Constraint
No discussion of bank valuation is complete without examining regulatory capital requirements, which fundamentally constrain growth, risk-taking, and distributions. The Basel III framework, fully implemented across the EU as of 2024, establishes a comprehensive capital regime that directly impacts valuation.
Common Equity Tier 1: The Core Capital Metric
Common Equity Tier 1 (CET1) capital represents the highest quality capital—primarily common shares and retained earnings—that can absorb losses while the bank remains a going concern. As of 2026, European banks must maintain:
- Minimum CET1 ratio: 4.5% of risk-weighted assets
- Capital conservation buffer: 2.5%
- Countercyclical buffer: 0-2.5% (varying by jurisdiction and credit cycle phase)
- Systemic risk buffers: 1-3.5% for G-SIBs (Global Systemically Important Banks)
- Pillar 2 requirements: Additional bank-specific requirements from supervisory review
In practice, most European banks target CET1 ratios of 13-15%, providing a management buffer above regulatory minimums. This buffer serves multiple purposes: absorbing unexpected losses, supporting organic growth, funding acquisitions, and enabling capital distributions.
The SREP Process and Pillar 2 Requirements
The Supervisory Review and Evaluation Process (SREP) represents the European Central Bank's framework for assessing individual bank risks and setting institution-specific capital requirements. Through SREP, supervisors evaluate:
- Business model sustainability and viability
- Internal governance and risk management
- Capital adequacy relative to risk profile
- Liquidity and funding risk
SREP outcomes directly impact valuation through Pillar 2 requirements (P2R) and Pillar 2 guidance (P2G). A bank receiving elevated P2R faces higher effective capital requirements, constraining distribution capacity and potentially signaling supervisory concerns about risk management or business model sustainability.
For example, a bank with 14% CET1 ratio might appear well-capitalized against the 10.5% combined buffer requirement. However, if SREP assigns 2% P2R and 1.5% P2G, the effective requirement becomes 14%, leaving minimal room for distributions or growth. This constraint depresses valuation multiples relative to peers with lower supervisory requirements.
Capital Planning and Distribution Capacity
Sophisticated bank valuation requires modeling capital dynamics over the projection period. The key equation:
CET1(t+1) = CET1(t) + Retained Earnings - RWA Growth × Target CET1 Ratio
Distribution capacity emerges as the residual after funding required capital for growth and maintaining target ratios. Consider a bank with:
- €500 billion RWA, 14% CET1 ratio (€70 billion CET1 capital)
- €5 billion annual net income (10% ROE on €50 billion tangible equity)
- 5% annual RWA growth
- 14% target CET1 ratio
Capital required for growth: €500bn × 5% × 14% = €3.5 billion. Distributable capital: €5.0bn - €3.5bn = €1.5 billion, representing a 30% payout ratio. This analysis directly feeds into DDM valuation and explains why high-growth banks often trade at lower P/BV multiples than mature franchises—they must retain more capital to fund expansion.
06 Integrating the Frameworks: A Holistic Approach
Professional bank valuation rarely relies on a single methodology. Instead, practitioners triangulate across multiple approaches to develop a comprehensive view of intrinsic value.
The Valuation Matrix
A robust bank valuation typically includes:
- DDM analysis: Base case, upside, and downside scenarios with varying growth and payout assumptions
- P/BV multiples: Current trading multiples, historical ranges, and peer comparisons
- Residual income model: Present value of economic profits (ROE - COE) × Book Value
- Sum-of-the-parts: For diversified groups, valuing business lines separately using appropriate multiples
- Precedent transactions: M&A multiples for comparable deals, adjusted for market conditions
The residual income model deserves particular attention as it bridges DDM and P/BV approaches. The model values a bank as current book value plus the present value of future economic profits:
Value = Book Value + Σ [(ROE(t) - COE) × Book Value(t-1)] / (1 + COE)^t
This formulation makes explicit that value creation comes from earning returns above the cost of capital. A bank earning exactly its cost of equity should trade at 1.0x book value; premiums and discounts reflect expectations of sustained positive or negative spreads.
Sensitivity Analysis and Key Value Drivers
Bank valuations prove highly sensitive to key assumptions. A typical sensitivity analysis examines:
- ROE variation: ±200 basis points can change valuation by 20-30%
- Cost of equity: ±100 basis points impacts value by 15-25%
- Growth rates: Particularly important for DDM, ±100 basis points affects value by 10-20%
- Terminal P/BV multiple: For multi-stage models, terminal multiple assumptions drive 40-60% of value
Consider a bank valued at €45 per share using base case assumptions (10% ROE, 9% COE, 3.5% growth). If ROE improves to 11%, value increases to €52 per share (+16%). Conversely, if cost of equity rises to 10% due to increased risk perception, value falls to €38 per share (-16%). This sensitivity underscores the importance of rigorous fundamental analysis.
07 Current Market Dynamics and Valuation Trends
The banking valuation landscape of 2025-2026 reflects several powerful trends that inform current multiples and future expectations.
The Interest Rate Environment
Following aggressive tightening through 2023-2024, European central bank rates have stabilized in the 2.5-3.0% range as of Q1 2026. This normalization has profoundly impacted bank valuations:
- Net interest margins expanded 60-80 basis points from trough levels, driving ROE improvement
- Asset quality concerns emerged as higher rates stress borrowers, particularly in commercial real estate
- Duration risk in securities portfolios crystallized losses for some institutions
- Deposit competition intensified as customers became rate-sensitive
Banks that successfully managed this transition—repricing assets faster than liabilities, maintaining deposit franchises, and avoiding excessive duration risk—have seen valuation multiples expand. Conversely, institutions caught with significant unrealized losses or deposit flight trade at compressed multiples.
Technology and Digital Transformation
The valuation premium for digital leaders has widened. Banks with advanced digital capabilities trade at 1.2-1.4x P/BV versus 0.6-0.8x for digital laggards. The differential reflects:
- Cost advantages: 40-50% lower cost-to-serve for digital transactions
- Revenue opportunities: Enhanced cross-sell, personalization, and embedded finance
- Competitive moat: Customer acquisition and retention advantages
- Scalability: Ability to grow without proportional cost increases
M&A activity increasingly focuses on digital capabilities, with acquirers paying premiums of 1.5-2.0x book value for targets with proven digital franchises, compared to 0.8-1.2x for traditional banks.
ESG and Climate Risk
Environmental, social, and governance factors increasingly influence bank valuations. Institutions with high exposure to carbon-intensive sectors face:
- Elevated cost of equity as investors demand climate risk premiums
- Potential asset quality deterioration as transition risks materialize
- Regulatory pressure through climate stress tests and capital add-ons
- Reputational risks affecting franchise value
Leading banks have integrated climate risk into credit models, set net-zero targets, and developed sustainable finance capabilities. These institutions trade at premiums reflecting lower perceived risk and better positioning for the energy transition.
08 Practical Application: Building a Bank Valuation Model
For professionals building bank valuation models, several practical considerations ensure robust analysis:
Data Requirements and Sources
Comprehensive bank valuation requires:
- Historical financials: 5-10 years of income statements, balance sheets, and capital ratios
- Regulatory disclosures: Pillar 3 reports, SREP outcomes, stress test results
- Peer data: Comparable institutions for multiple analysis and benchmarking
- Market data: Equity prices, credit spreads, analyst estimates
- Macroeconomic forecasts: GDP growth, interest rates, unemployment for scenario analysis
Common Pitfalls to Avoid
- Ignoring asset quality cycles: Normalizing credit costs based on through-cycle experience rather than current benign conditions
- Overstating terminal values: Using aggressive perpetual growth rates or terminal multiples that imply unrealistic long-term value creation
- Neglecting regulatory constraints: Projecting distributions that exceed sustainable payout ratios given capital requirements
- Misunderstanding business models: Applying universal bank multiples to specialized institutions (private banks, asset managers, etc.)
- Static analysis: Failing to stress-test assumptions under adverse scenarios
Technology-Enabled Valuation
Modern valuation platforms have transformed bank analysis efficiency. Professional tools enable:
- Automated data aggregation from regulatory filings and market sources
- Integrated scenario analysis across multiple methodologies
- Real-time peer benchmarking and relative valuation
- Sensitivity analysis and Monte Carlo simulation
- Regulatory capital modeling and distribution capacity forecasting
These capabilities allow analysts to focus on judgment and interpretation rather than mechanical calculations, improving both accuracy and productivity.
09 Looking Forward: The Evolution of Bank Valuation
As we progress through 2026 and beyond, several developments will shape bank valuation practice:
Regulatory evolution: Basel III finalization (the "Basel IV" reforms) will increase capital requirements for certain asset classes, particularly operational risk and credit valuation adjustment (CVA) risk. Banks with elevated exposures will face compressed multiples as ROE comes under pressure.
Digital disruption: The continued rise of neobanks, embedded finance, and Big Tech entry into financial services will intensify competitive pressure. Traditional banks must demonstrate sustainable competitive advantages to maintain valuation premiums.
Climate integration: As climate risk quantification improves, expect more explicit incorporation into cost of equity calculations and capital requirements. Banks leading on climate risk management should see valuation benefits.
Consolidation dynamics: Persistent excess capacity in European banking suggests continued M&A activity. Valuation frameworks must account for potential synergies, integration risks, and regulatory approval considerations.
For professionals navigating this complex landscape, rigorous analytical frameworks combined with deep industry knowledge remain essential. The integration of DDM, P/BV, and regulatory capital analysis provides a comprehensive toolkit for assessing bank intrinsic value. However, successful valuation ultimately requires judgment about sustainable competitive advantages, management quality, and long-term industry dynamics.
As the banking sector continues its digital transformation while managing regulatory complexity and evolving risks, valuation professionals must continuously refine their approaches. Platforms like iValuate support this evolution by providing sophisticated analytical tools that enable efficient, comprehensive bank valuation while allowing professionals to focus on the strategic insights that drive investment decisions. Whether conducting M&A due diligence, equity research, or portfolio management, mastering these specialized valuation techniques remains fundamental to success in financial services investing.